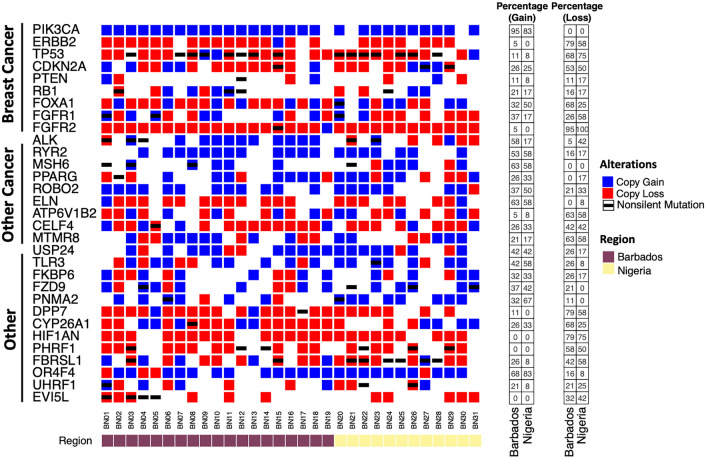
Fig. 4.
Copy number variation (CNV) analysis revealed no differences between Barbadian and Nigerian samples. Using NEXUS Copy Number (v10) analysis toolkits, most common CNV were investigated. The copy number gain across each sample is presented in blue and copy number loss in red. The black line indicates a non-silent somatic mutation. The bottom panel indicates region of sample origin. Left panels show percent alterations across each copy number event across two different populations. Bi-allelic mutation illustrated by black bar and either blue or red square indicating non-silent somatic mutation and either copy gain or less, respectively. No significance (p < 0.05) was detected in this cohort of samples

