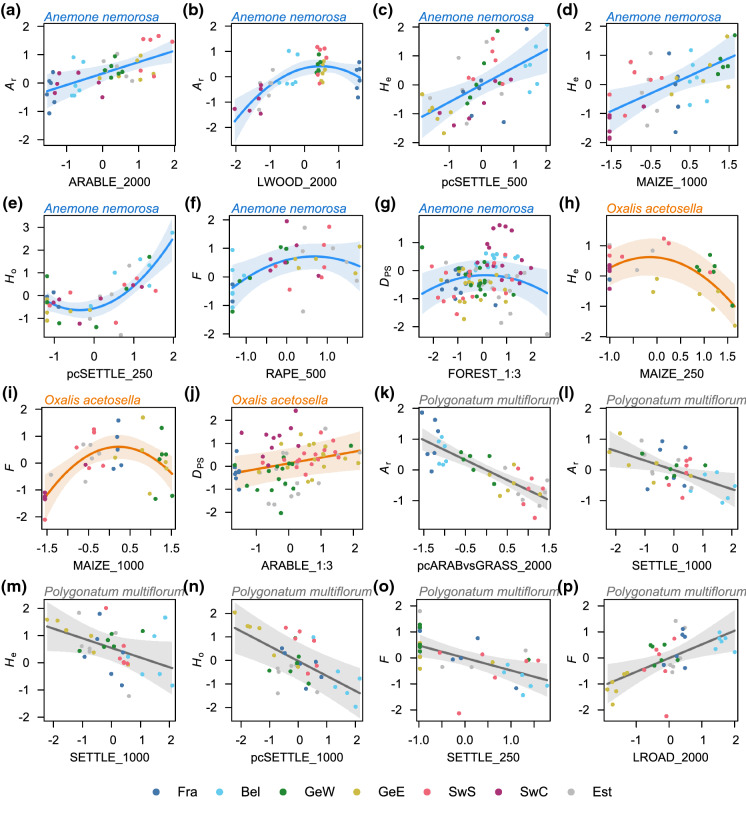
Fig. 2.
Visualization of landscape effects (cf. Tables 2 and 3) on population genetic variables of Anemone nemorosa, Oxalis acetosella and Polygonatum multiflorum. Shown are those effects, which are directly related to our hypotheses and therefore discussed in the main text. Panels display the partial slopes and residuals as well as the 95% confidence band. All variables are scaled in standard deviation units. Colours of partial residuals represent the different landscape windows: France (Fra), Belgium (Be), West Germany (GeW), East Germany (GeE), South Sweden (SwS), Central Sweden (SwC), and Estonia (Est). Population genetic variables are allelic richness (Ar), expected (He) and observed heterozygosity (Ho), inbreeding index (F), and genetic differentiation (DPS). The landscape metrics ARABLE, FOREST, MAIZE, RAPE, and SETTLE refer to the percent cover of arable land, deciduous forest, maize, oilseed rape and settlement area, respectively. LWOOD and LROAD refer to the relative length of hedgerows/tree lines and roads, respectively. pcSETTLE is a principal component reflecting settlement area, road density and edge density (cf. Table 2). pcARABvsGRASS is a principal component reflecting the trade-off between arable land (cereals and oilseed rape) on the one hand and grassland on the other hand (cf. Table 2). Numbers or ratios added to the variable names correspond to the most influential buffer distance in meters or the most influential width-to-length radio of the landscape strips, respectively

