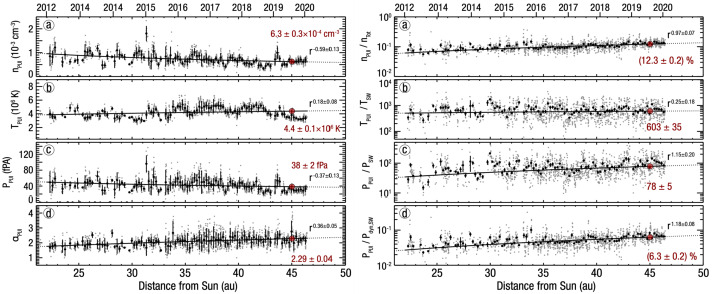
Fig. 18.
(left) SWAP PUI measurements between 22 and 47 au (gray data points). Power-law functions are fit to solar rotation-averaged values (black data with uncertainties), whose uncertainties represent the time variability within each time-averaged sample. The power law fits are shown in black and nominal values of PUI parameters at 45 au in red. (right) Ratios of daily-averaged parameters (gray) and ratios binned over solar rotation (black). Power-law fits to the ratios are shown in black. From McComas et al. (2021)

