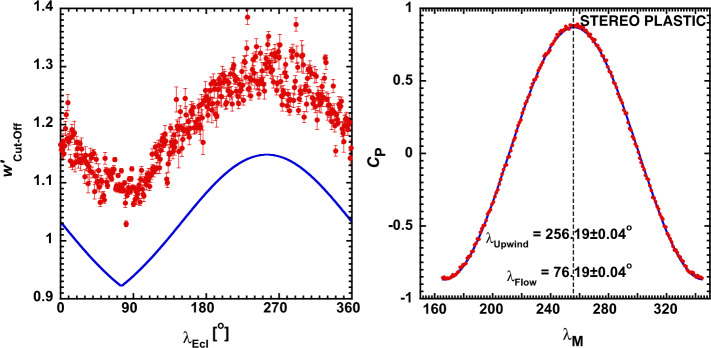
Fig. 6.
(Left) in the solar wind frame obtained from a fit to each daily PUI distribution with the statistical fit errors. The model curve shows a constant offset, likely due to the simplifications that do not consider the exact cut-off shape nor an integration over the sensor FOV and energy bands. (Right) Pearson correlation coefficient between the cut-off values on the left and the same values mirror-imaged about a mirror line shown as a function of . Also shown is a fit with a cosine function. The maximum correlation is associated with the upwind direction of the ISN flow. From Möbius et al. (2015, 2016b). © AAS. Reproduced with permission

