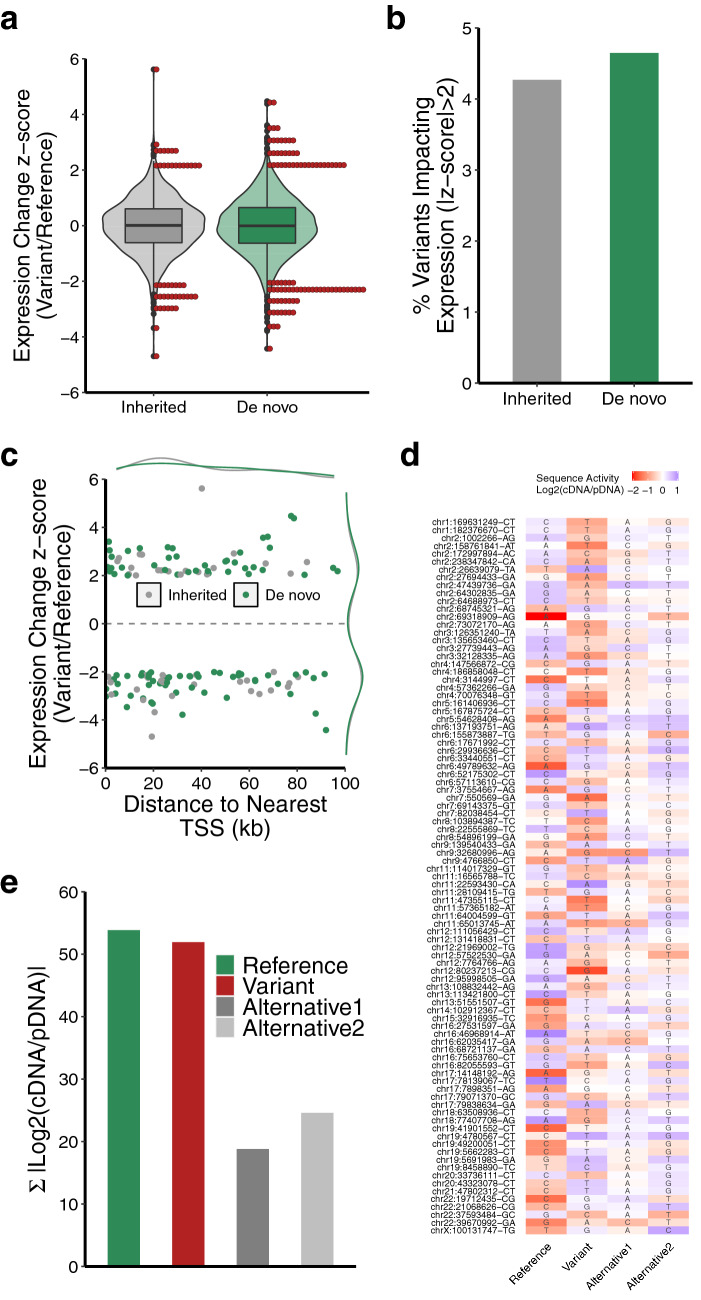
Figure 3.
Rare genetic variants alter the regulatory capacity of genomic sequences. (a) Distribution of expression differences between reference and variant alleles profiled in MPRA (red points denote variants with an expression difference |z-score| > 2). (b) Fraction of profiled rare variants that alter regulatory capacity of genomic sequences. (c) Distance to nearest TSS for variants that alter the regulatory capacity of genomic sequences (|z-score| > 2). (d) Heatmap showing regulatory capacity of all possible alleles corresponding to de novo variants that display altered regulatory capacity (|z-score| > 2). (e) Aggregated regulatory capacity of genomic sequences shown in (d) by allele type.

