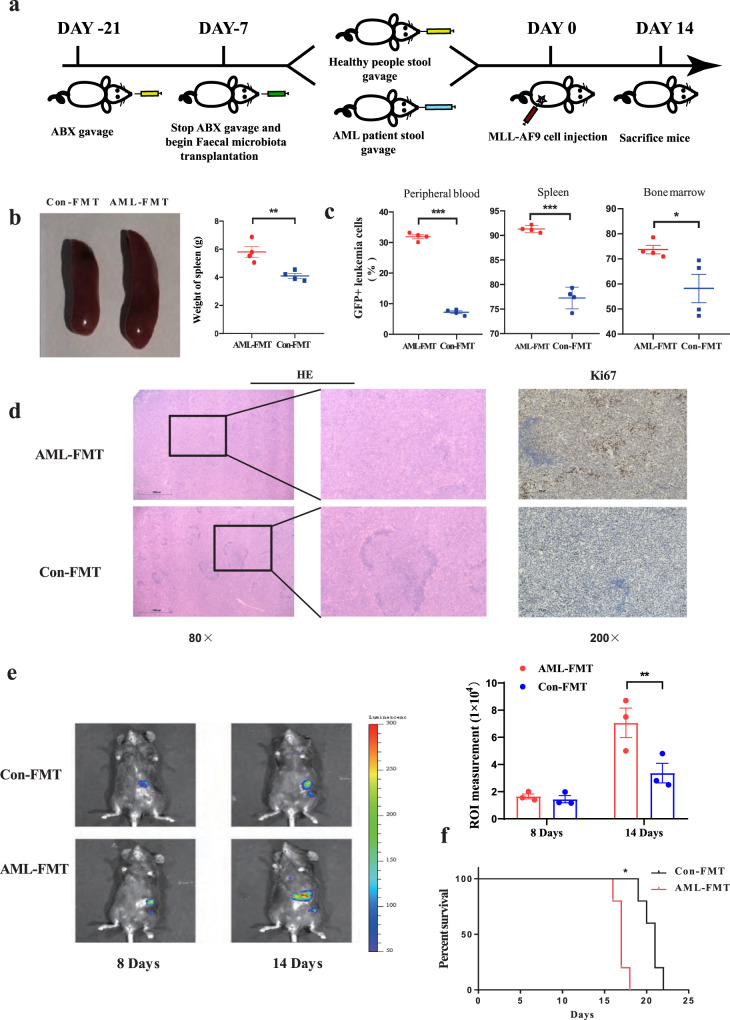
Fig. 3. FMT delays the development of AML.
a Schematic diagram of the mouse AML-FMT process. b Photographs and weights of spleens from AML-FMT mice (n = 4) and Con-FMT mice (n = 4). c Leukaemia cells (GFP+ cells) in the spleen, peripheral blood, and bone marrow from AML-FMT mice (n = 4) and Con-FMT mice (n = 4). Details of the gating strategy are described in Supplementary Fig. 11b. d HE histopathology sections and Ki67 immunohistochemical staining of a representative spleen, the AML-FMT group, and the Con-FMT group. All microscopic analyses were performed at an original magnification ×80 or ×200, scale bar = 1000 and 275 µm. e On days 8 and 14 after the injection, the load of Luciferase expressing MLL-AF9 cells in mice was analysed by IVIS (n = 3 per group). f Kaplan–Meier survival curve of AML mice (n = 5 per group). P values were determined using unpaired two-tailed t-test and error bars represent mean ± SEM in b, c, e. P values were determined using Gehan–Breslow–Wilcoxon test and error bars represent mean ± SEM in f. **P = 0.0069 (b), ***P < 0.0001 PB, ***P < 0.0001 SP, *P = 0.0114 BM (c), *P = 0.0473 (e), **P = 0.0039 (f). Source data are provided as a Source Data file.

