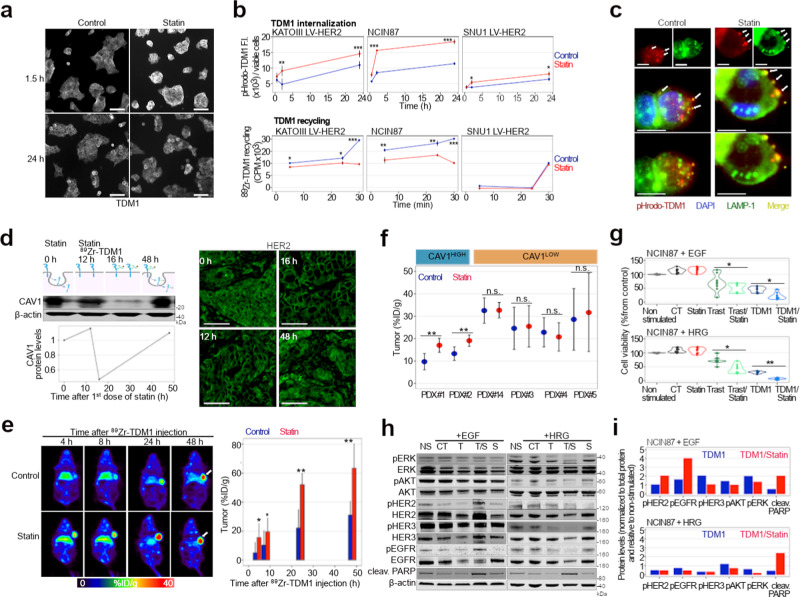
Fig. 3. Statins enhance TDM1 binding and internalization.
a Confocal images of immunofluorescence of TDM1 in the presence or absence of lovastatin. Scale bars: 20 μm. b TDM1 internalization and recycling in NCIN87 GC cells wild-type (WT) and AGS, KATOIII, SNU1 GC sublines stably expressing HER2 (LV-HER2) in the presence and absence of lovastatin. The pHrodo-TDM1 fluorescent signal was normalized to the number of viable cells (*P < 0.05, **P < 0.01, ***P < 0.001 based on a Student’s t test, n = 4). c Confocal images of immunofluorescence staining of pHrodo-TDM1 and LAMP1 in NCIN87 cells in the presence and absence of lovastatin. Scale bars: 100 μm and 50 μm (inset). d Western blot of CAV1 and HER2 immunofluorescence in NCIN87 s.c. tumors from athymic nude mice. Lovastatin (8.3 mg/kg of mice) was orally administrated twice with an interval of 12 h between each administration. Scale bars: 50 μm. e Representative coronal PET images and TDM1-tumor uptake at 4, 8, 24, and 48 h p.i. of [89Zr]Zr-DFO-TDM1 in athymic nude mice bearing s.c. NCIN87 tumors. Lovastatin (8.3 mg/kg of mice) was orally administrated 12 h prior and at the same time as the tail vein injection of [89Zr]Zr-DFO-TDM1 (6.66–7.4 Mbq, 45–50 μg protein). Bars, n = 5 mice per group, mean ± S.E.M. *P < 0.05, **P < 0.01, ***P < 0.001 based on a Student’s t test. %ID/g, percentage of injected dose per gram. f [89Zr]Zr-DFO-TDM1 uptake in HER2-expressing gastric PDXs containing varying levels of CAV1 and administered saline (blue color) or statin (red color). PDX IDs in this figure match patient IDs shown in Fig. 1. Points, n = 5 mice per group, mean ± S.E.M, **P < 0.01 based on a Student’s t test. %ID/g, percentage of injected dose per gram. g Cell viability of NCIN87 cells at 48 h after cells incubation with Trastuzumab (Trast) and TDM1 alone or in combination with lovastatin. Bars, n = 5–7 per group, mean ± S.E.M. *P < 0.05, **P < 0.01, based on a Student’s t test. h, i Western blots of HER2 signaling and quantification of NCIN87 cells after 48 h incubation with TDM1 alone or in combination with lovastatin. Bars, quantification of Western blots shown in Fig. 3i. Supplementary Fig. 13 shows quantifications of three independent assays. Source data are provided as a Source Data file.

