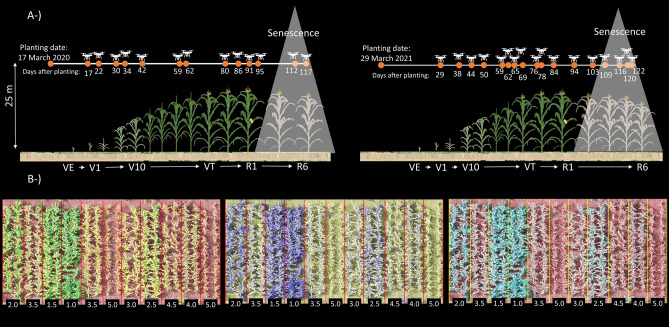
Figure 2.
(A) The number flight times used in 2020 (left) and in 2021 (right); senescence scored using the orthomosaics of latest four flights in 2021 and two flights in 2020. (B) Variation in senescence and illustration of senescence scores on a scale of 0 to 5 (numbers in black boxes) among different maize row plots (each is plot is two rows, outlined by red or yellow rectangles). Three band channels in orthomosaics were set in QGIS as red–green–blue, red–red–green, and red-green-green from left to right respectively and resulted in three different illustrations in highlighting the row plots with different senescence scores.

