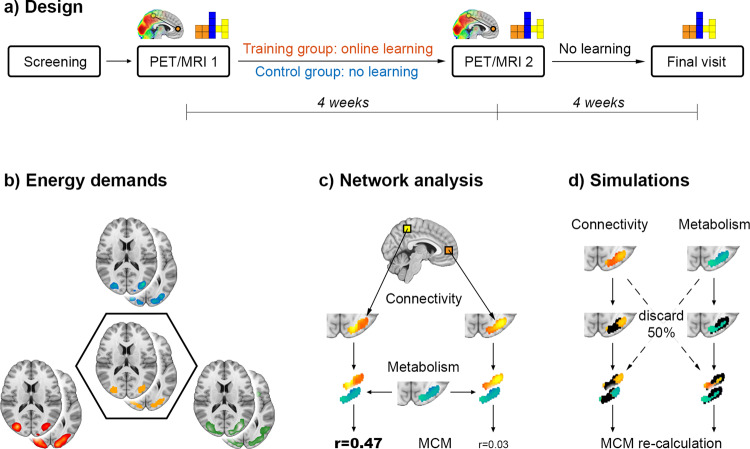
Fig. 1. Design and analysis.
a After the initial screening, participants were randomly assigned to the training or the control group. All subjects underwent two simultaneous PET/MRI examinations for acquisition of structural, functional and metabolic data at resting-state and while performing a challenging visuo-spatial processing task (the video game Tetris®, Supplementary Fig. S1). In the 4-week period between the two PET/MRI scans, the training group regularly practiced the task using an online platform, whereas the control group did not. After the second PET/MRI scan, no further training was carried out and the training group completed a final task session on a laptop. Additional testing of different cognitive domains was performed at both PET/MRI examinations. b To obtain a robust estimate of task-specific increases in energy demands, the imaging parameters of glucose metabolism (blue), cerebral blood flow (green) and BOLD-derived activation (red) were combined in a conjunction analysis (intersection, orange). Joint active areas served as target regions for the subsequent network analysis (Supplementary Fig. S2). c We extended metabolic connectivity mapping (MCM) to the whole-brain level to assess learning-induced adaptations in directional connectivity towards regions with high task-specific energy demands. The BOLD signal of each brain voxel (exemplarily shown as yellow/orange squares) yields a certain functional connectivity pattern in the target region (here the occipital cortex). Computing the spatial correlation between patterns of functional connectivity (yellow/orange) and glucose metabolism (blue/green) results in an MCM value for each brain voxel that reflects the directional connectivity to the target. d Finally, simulations were carried out to disentangle the individual contribution of glucose metabolism and functional connectivity to MCM learning effects. Voxels in the target region were gradually removed based on values of connectivity or metabolism (here 50% black voxels in left and right columns, respectively), followed by recalculation of MCM values and the corresponding learning effects.

