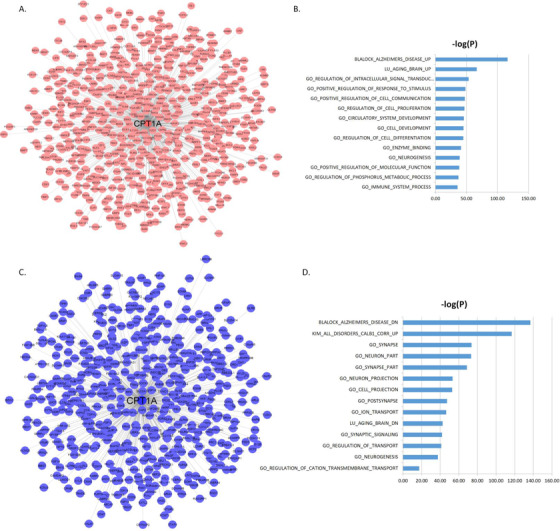
FIGURE 3.

CPT1A centered co‐expression networks. A, The genes positively correlated with CPT1A (false discovery rate [FDR] < 10‐6). B, MSigDB GO and canonical pathways enriched in the CPT1A centered subnetwork shown in (A). C, The genes negatively correlated with CPT1A (FDR < 10‐6). D, MSigDB GO and canonical pathways enriched in the CPT1A centered subnetwork shown in (C). The blue bars represent the –log10 values of the adjusted P‐values
