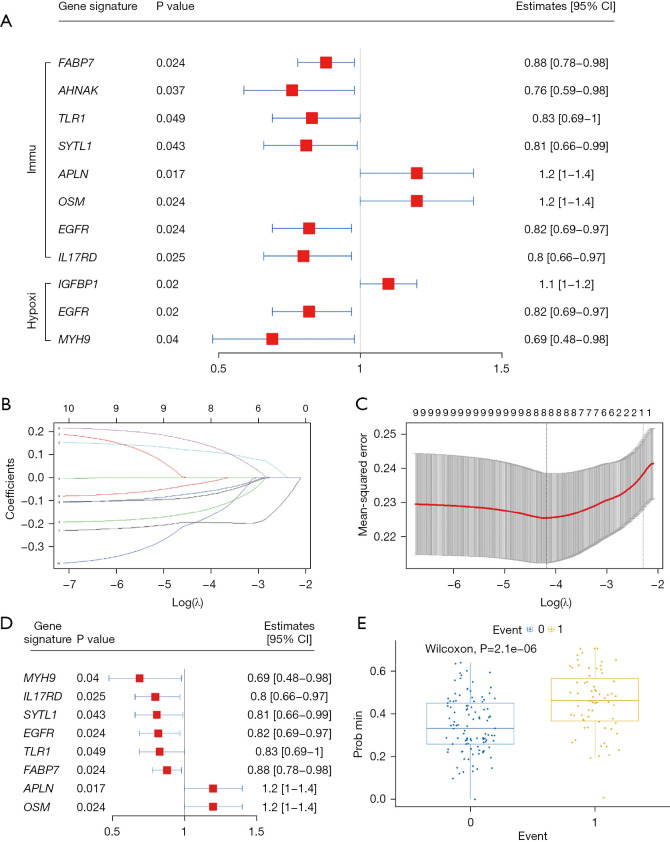
Figure 3.
Hypoxia- and immune-associated prognosis signature. (A) Forest plot of hazard ratios for 10 hypoxia- and immune-associated prognostic differentially expressed genes (DEGs). (B) Least absolute shrinkage and selection operator (LASSO) coefficient profiles of the hypoxia- and immune-associated prognostic DEGs. Each curve in the figure represents the changing trajectory of each independent variable coefficient. The Y axis indicates the value of the coefficient. The lower X axis shows log (λ) and the upper X axis shows the number of non-zero coefficients in the model. (C) Three-fold cross-validation of the tuning parameter selection in the LASSO model. The lower X axis indicates log (λ), and the upper X axis indicates the average number of genes associated with prognosis. Partial likelihood deviance values are shown, with error bars representing standard error (SE). The vertical black dotted lines are drawn at the optimal values by minimum criteria and 1 − SE criteria, which provides the best fit; (D) Forest plot of hazard ratios for 8 hypoxia- and immune-associated prognostic DEGs; (E) Distributions of risk score and survival status. The predicted value of event 1 (death) is significantly higher than event 0 (survival).

