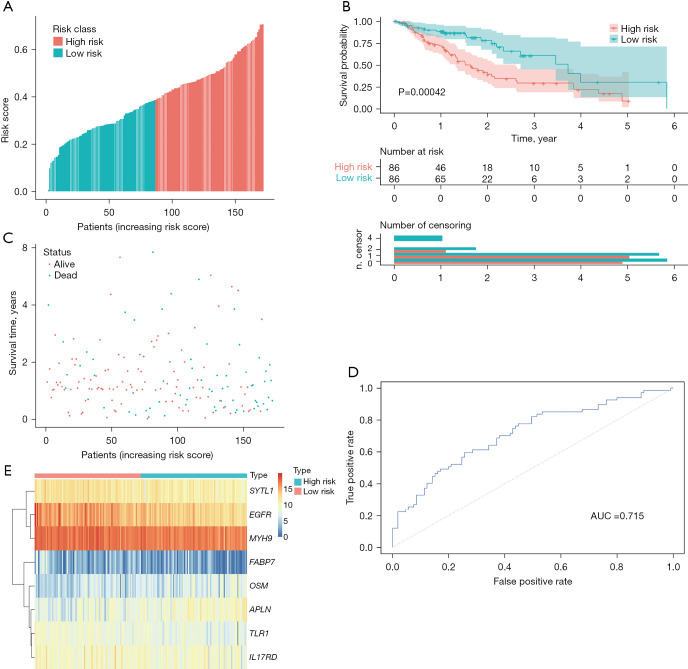
Figure 4.
Validation of the effectiveness of the hypoxia- and immune-associated prognosis prediction model. (A) The high- and low-risk groups according to the median risk score; (B) Kaplan-Meier curves of overall survival (OS) in 172 patients of the training cohort based on risk score; (C) distributions of risk score and survival status; (D) survival-dependent receiver operating characteristic (ROC) curve validation of the model for prognosis; (E) heat map of the expression distribution of 8 genes in the prognosis model. Red indicates high expression and blue indicates low expression.

