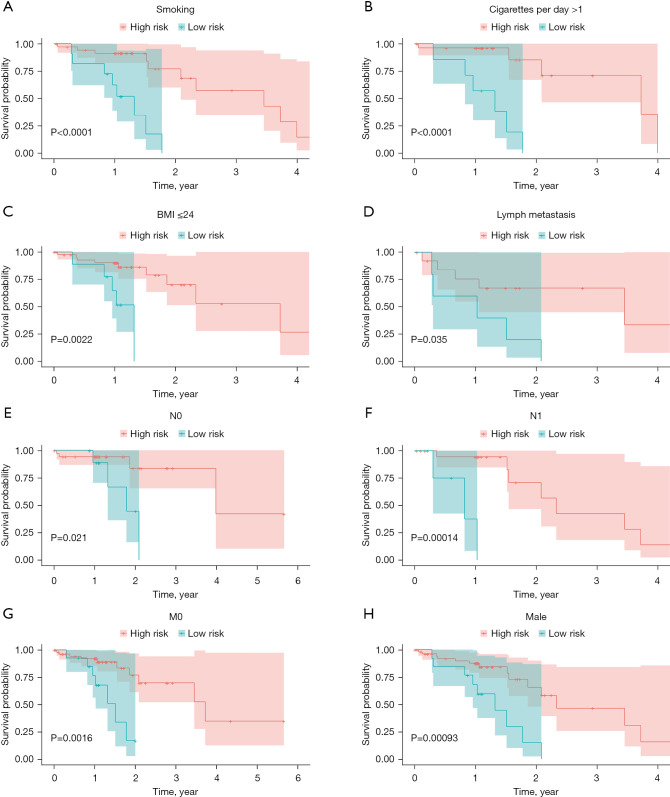
Figure 5.
Validation of the stability of the hypoxia- and immune-associated prognosis prediction model. Kaplan-Meier plot of overall survival by risk groups according to smoking status (A); more than 1 cigarette per day (B); body mass index (BMI) ≤24 kg/m2 (C); patients who received radiotherapy (D); N0 staging (E); N1 staging (F); M0 staging (G); and male gender (H).

