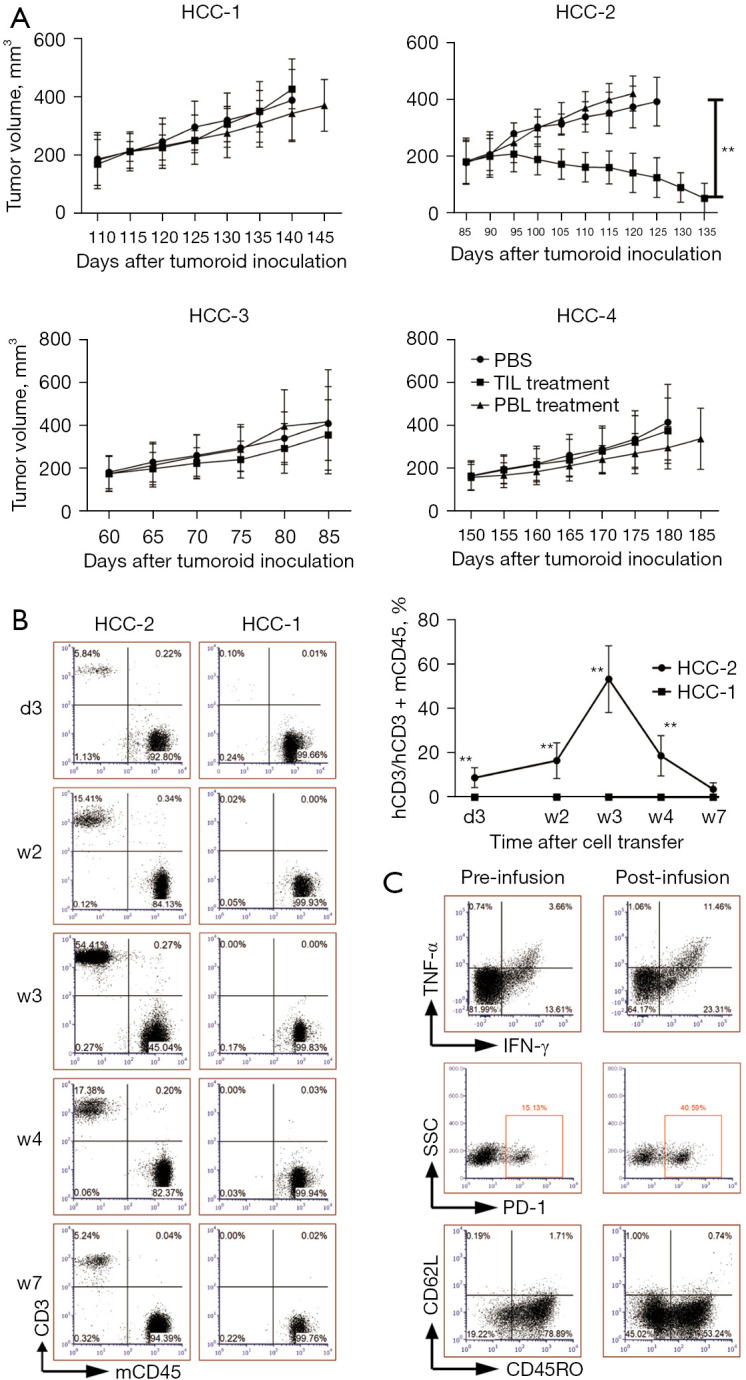
Figure 4.

Only TILs with the highest antitumor ability can inhibit tumor growth in autologous tumoroid xenograft mouse models. TILs or PBLs from four patients or PBS were injected into 3 mouse models each group as tumor volumes reached 150–200 mm3. (A) The tumor growth curve is shown. (B) Representative dot plots display the human CD3+ and mCD45+ cells in peripheral blood mononuclear cells on 3rd day (d3), 2nd week (w2), w3, w4, w7 post-adoptive transfer of TILs from HCC-2 and HCC-1 patients. The line graph summarizes the proportion of transferred CD3+ cells among peripheral mononuclear cells composed of hCD3+ and mCD45+ cells (n=3). (C) Representative dot plots suggest the percentages of PD-1, CR45RO, CD62L expressing and TNF-α plus IFN-γ secreting cells after PMA stimulation of peripheral human CD3+ T cells from HCC-2 patient on pre-infusion and 3 weeks post-infusion. **, P<0.01. HCC, hepatocellular carcinoma; hCD3, human CD3; IFN-γ, interferon γ; mCD45, murine CD45; PBLs, peripheral blood lymphocytes; PBS, phosphate buffer saline; PD-1, programmed death 1; PMA, phorbol 12-myristate 13-acetate; SSC, side scatter; TILs, tumor-infiltrating lymphocytes; TNF-α, tumor necrosis factor α.
