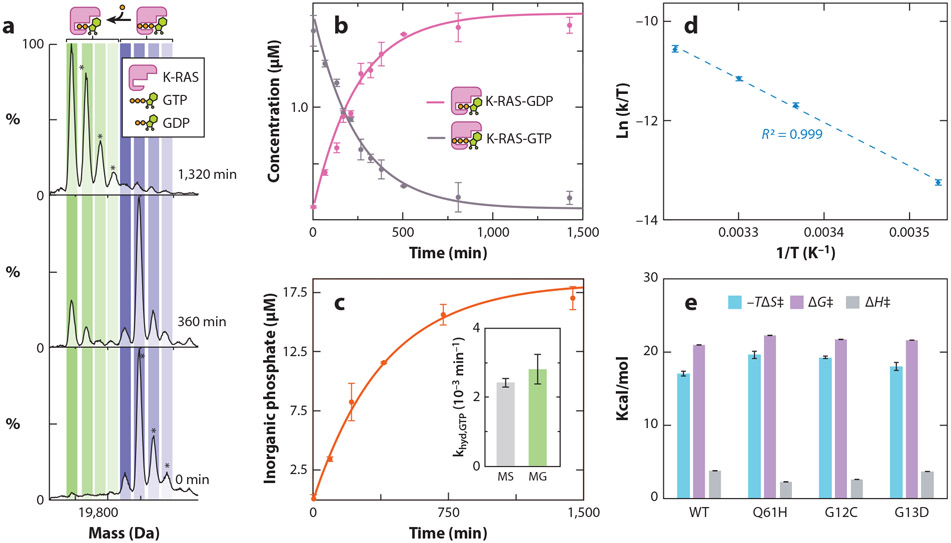
Figure 2.
Transition-state thermodynamics for the intrinsic GTPase activity of K-RAS and its oncogenic mutants. (a) Deconvoluted native mass spectra of K-RAS-GTP incubated at 25°C and recorded at multiple time points. Concurrent with the K-RAS-mediated hydrolysis of GTP is the occurrence of K-RAS binding to GDP. (b) Plot of the concentration of K-RAS bound to either GDP or GTP from deconvolution of native MS data (dots) and fit to a first-order rate constant model (solid lines). (c) Plot of inorganic phosphate concentration determined for K-RAS using a solution MG assay. The inset shows the rate constants determined by native MS and an MG assay, which are statistically indistinguishable. (d) Eyring plot for intrinsic GTPase activity of K-RAS. (e) Transition-state enthalpy (ΔH‡), entropy (ΔS‡), and change in Gibbs free energy (ΔG‡) determined by Eyring analysis (T = 298 K). Reported are the mean and standard deviation (n = 3). Figure adapted with permission from Reference 53, copyright 2019 American Chemical Society. Abbreviations: GDP, guanosine 5′-diphosphate; GTP, guanosine 5′-triphosphate; MG, malachite green; MS, mass spectrometry; WT, wild type.

