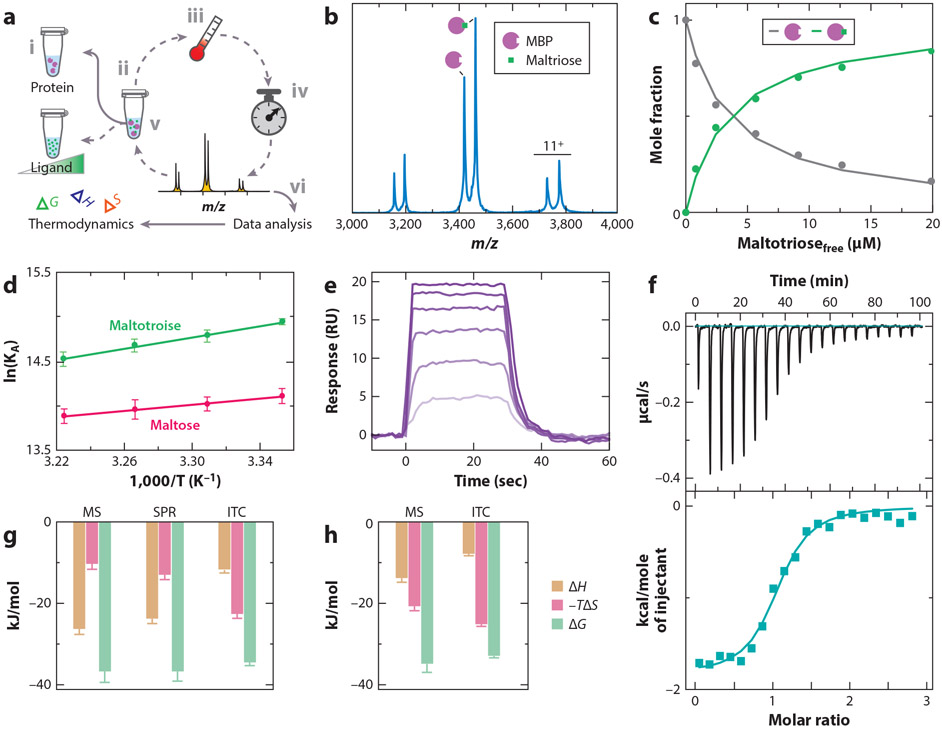
Figure 3.
Thermodynamics of soluble protein–ligand interactions. (a) An overview of the native mass spectrometry (MS) to determine binding thermodynamics. The protein at a fixed concentration (i) is titrated with ligand (ii) and loaded into a nano-electrospray ionization (ESI) emitter. The temperature is set (iii), and the sample is incubated for a given time to allow equilibrium to be reached (iv), followed by recording of a native mass spectrum (v). This procedure is repeated for different ligand concentrations and temperatures. The MS data are analyzed (vi) and used to determine thermodynamics, as described in panels b–d. (b) Representative mass spectrum of maltose binding protein (MBP) in the presence of maltotriose at 29°C. (c) Plot of mole fraction of apo- and maltotriose-bound MBP (dots) as a function of free ligand concentration. A protein–ligand binding model is fit to the data (solid lines) to determine equilibrium binding constants. (d) van’t Hoff plot for MBP binding to maltose and maltotriose. (e) Representative binding and dissociation surface plasmon resonance (SPR) profiles at 29°C for different concentrations of maltotriose injected onto a sensor surface containing immobilized MBP. (f) Isothermal calorimetry (ITC) power-versus-time plot for the titration (top) and integrated heat plotted as function of molar ratio (bottom). (g,h) Binding thermodynamics for MBP binding to (g) maltotriose or (h) maltose reported at a temperature of 298 K. Figure adapted with permission from Reference 15, copyright 2016 American Chemical Society.

