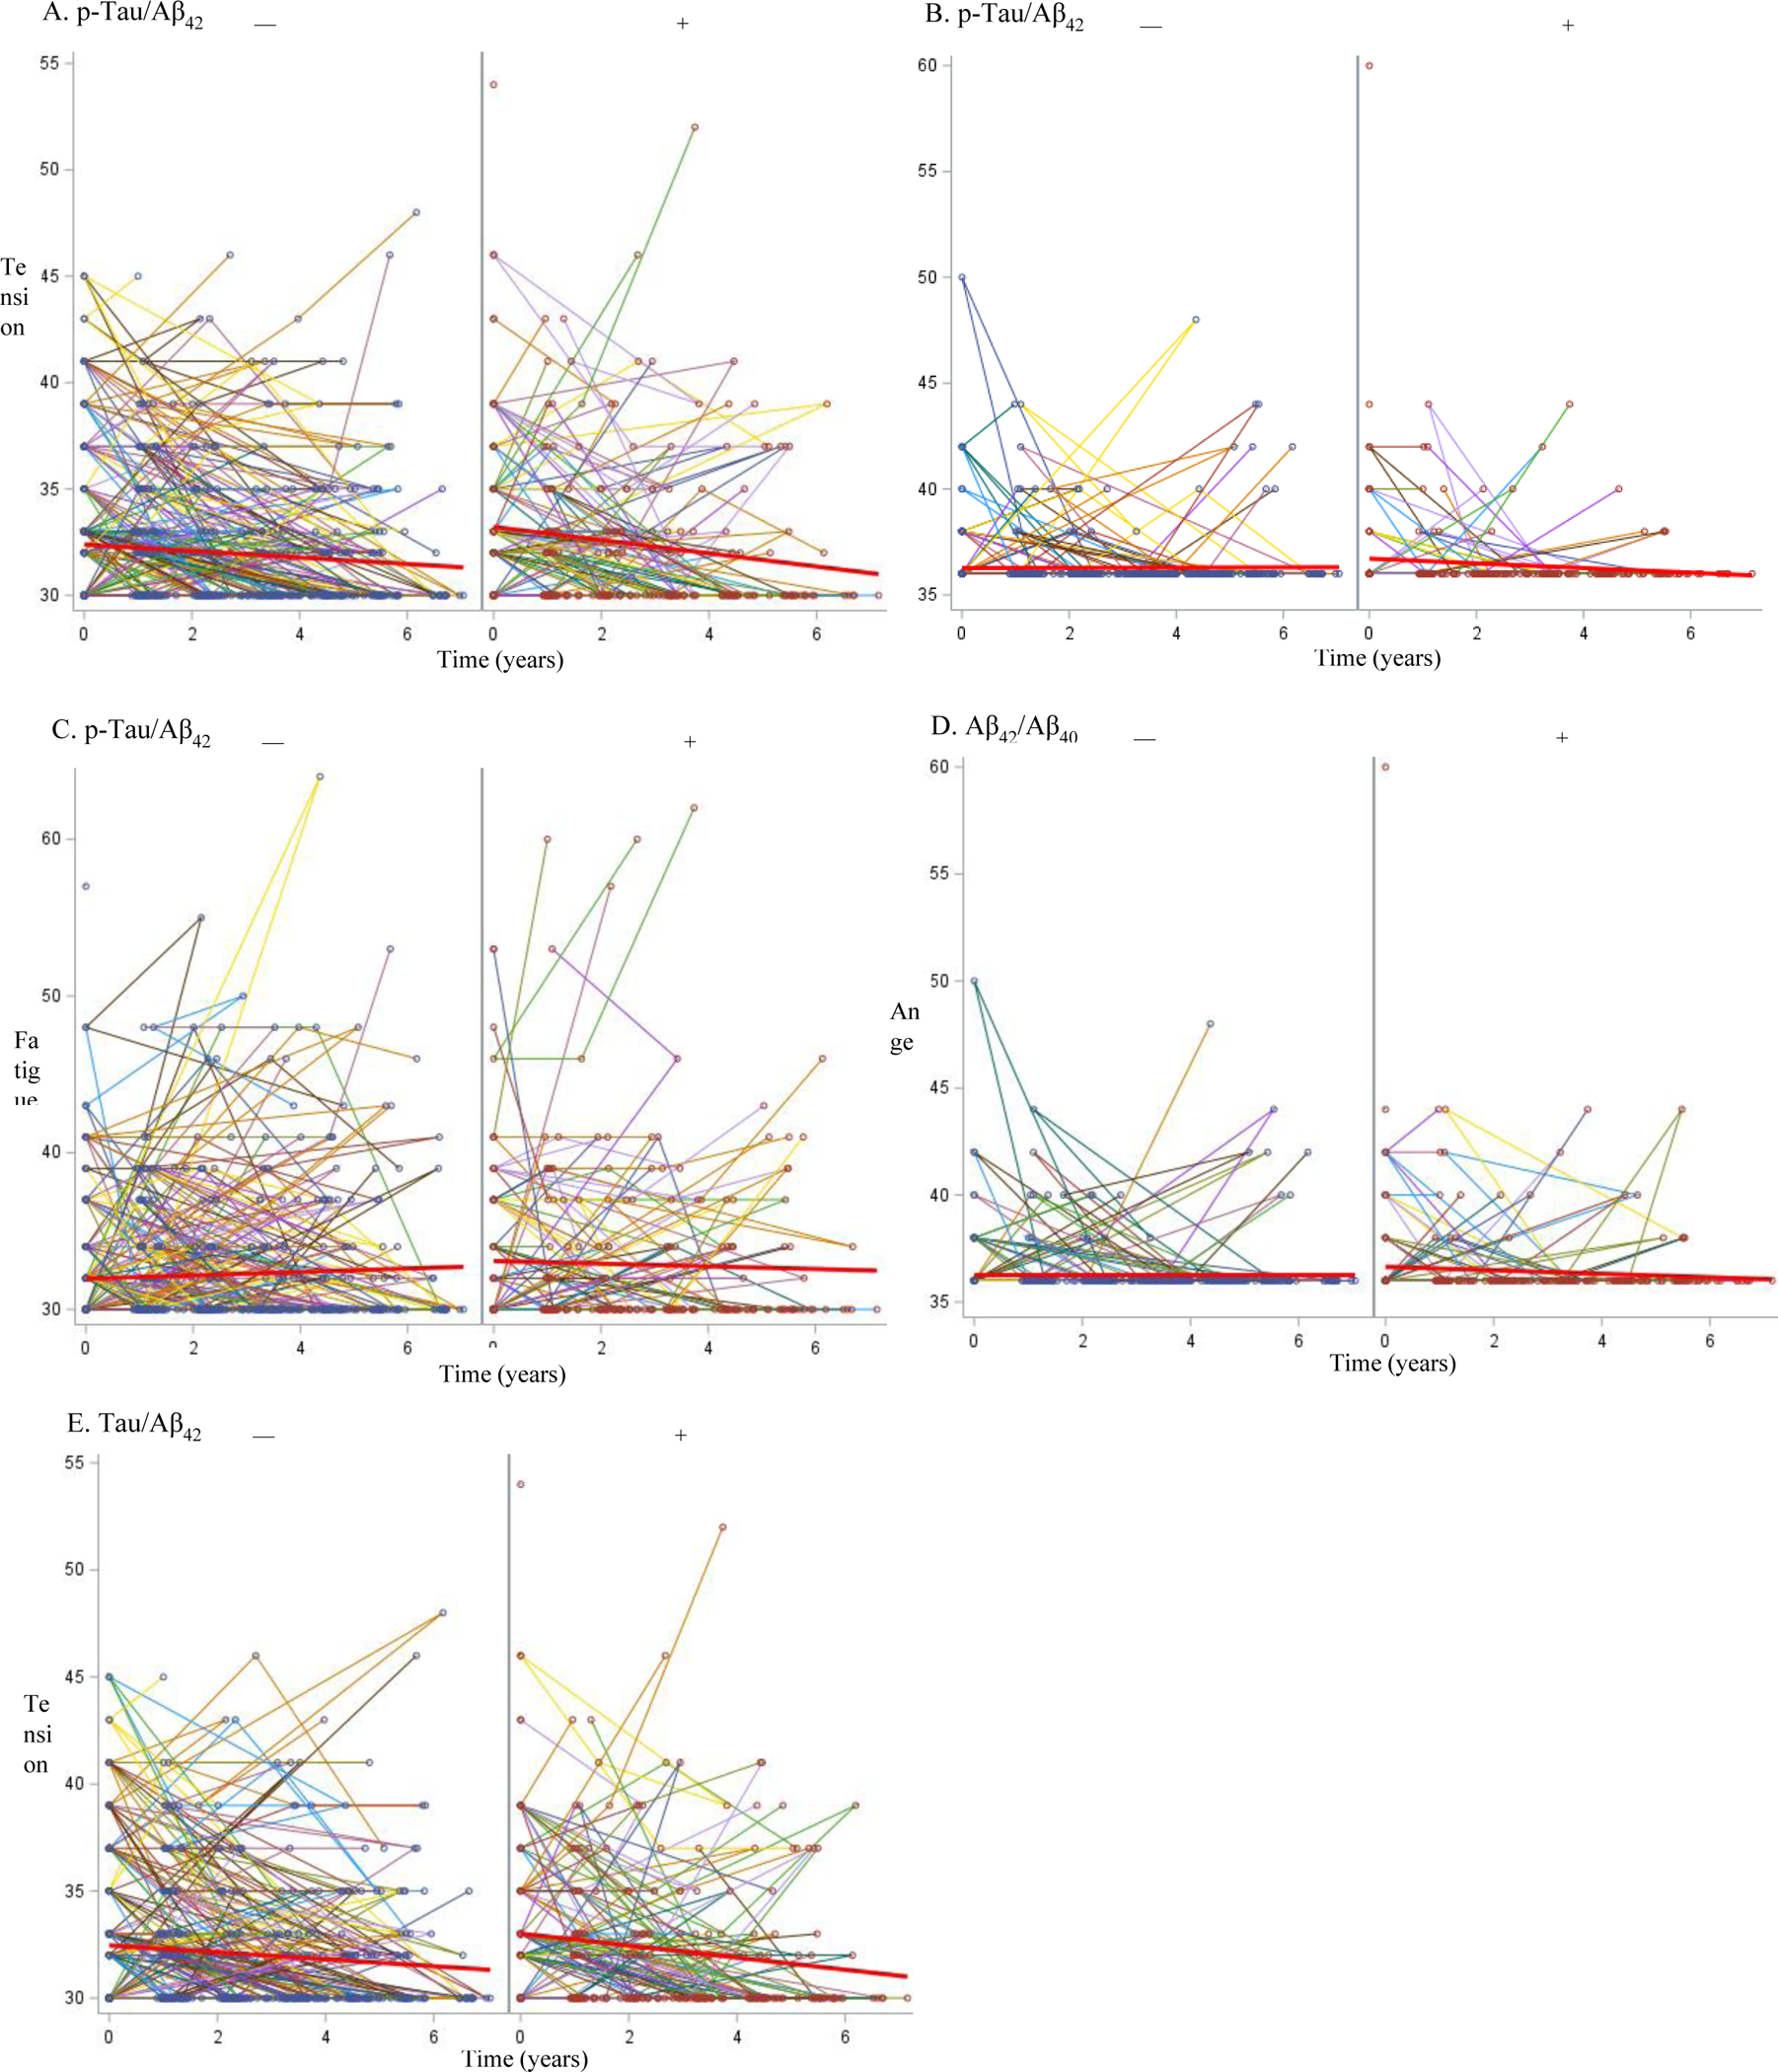
Figure 1. Spaghetti plots for preclinical AD biomarkers and POMS subscales.

Spaghetti plots show the changes in POMS mood subscales for tension/anxiety, anger, and fatigue for Aβ42/Aβ40, t-Tau/Aβ42, p-Tau/Aβ42, with preclinical AD − and + groups to the left and right, respectively. Individual lines represent longitudinal data for a single participant. POMS = Profile of Mood States.
