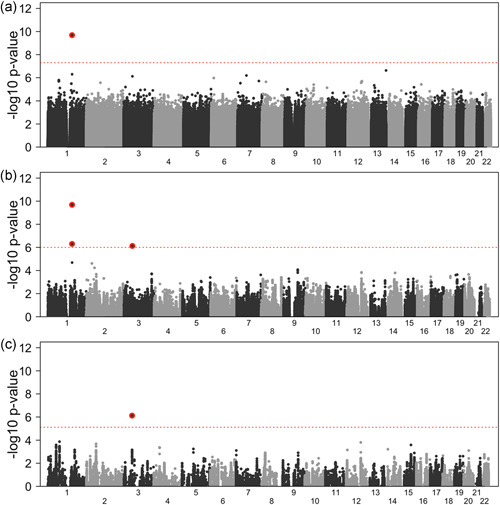
Figure 1.

GWAS meta‐analysis results. (a) Manhattan plot of the GWAS for all 8,242,287 SNPs passing quality control. The dashed horizontal line is at p = , representing the standard GWAS cut‐off for significance. (b) Manhattan plot of the GWAS for the 229,674 eQTL in platelet. The dashed horizontal line is at 6.00 (p = ), representing the cut‐off for a 5% FWER derived using permutations. (c) Manhattan plot of the GWAS for the 55,088 eQTL in megakaryocytes. The dashed horizontal line is at 5.12 (p = ), representing the cut‐off for a 5% FWER derived using permutations. SNPs passing the respective significance threshold at the PEAR1 (chromosome 1) and ARHGEF3 (chromosome 3) loci are highlighted with a red background. eQTL, expression quantitative trait loci; FWER, family‐wise error rate; GWAS, genome‐wide association studies; SNP, single nucleotide polymorphism
