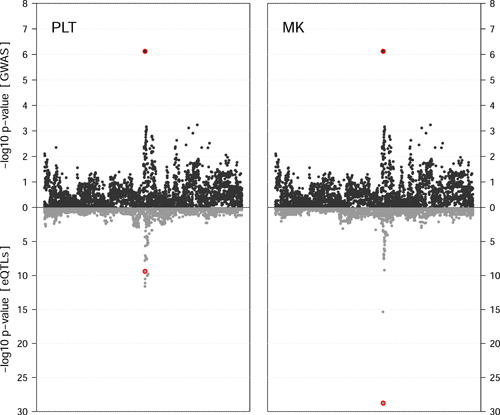
Figure 2.

Colocalization using meta‐analysis p values (dark grey) and eQTL p values for association with ARHGEF3 (light grey), separately for platelets (PLT) and megakaryocytes (MK) eQTL. For clarity of display, the x‐axis represent the index in the SNP set, not the genomic locations. The respective p values for SNP rs1354034 are highlighted with a red background. eQTL, expression quantitative trait loci; SNP, single nucleotide polymorphism
