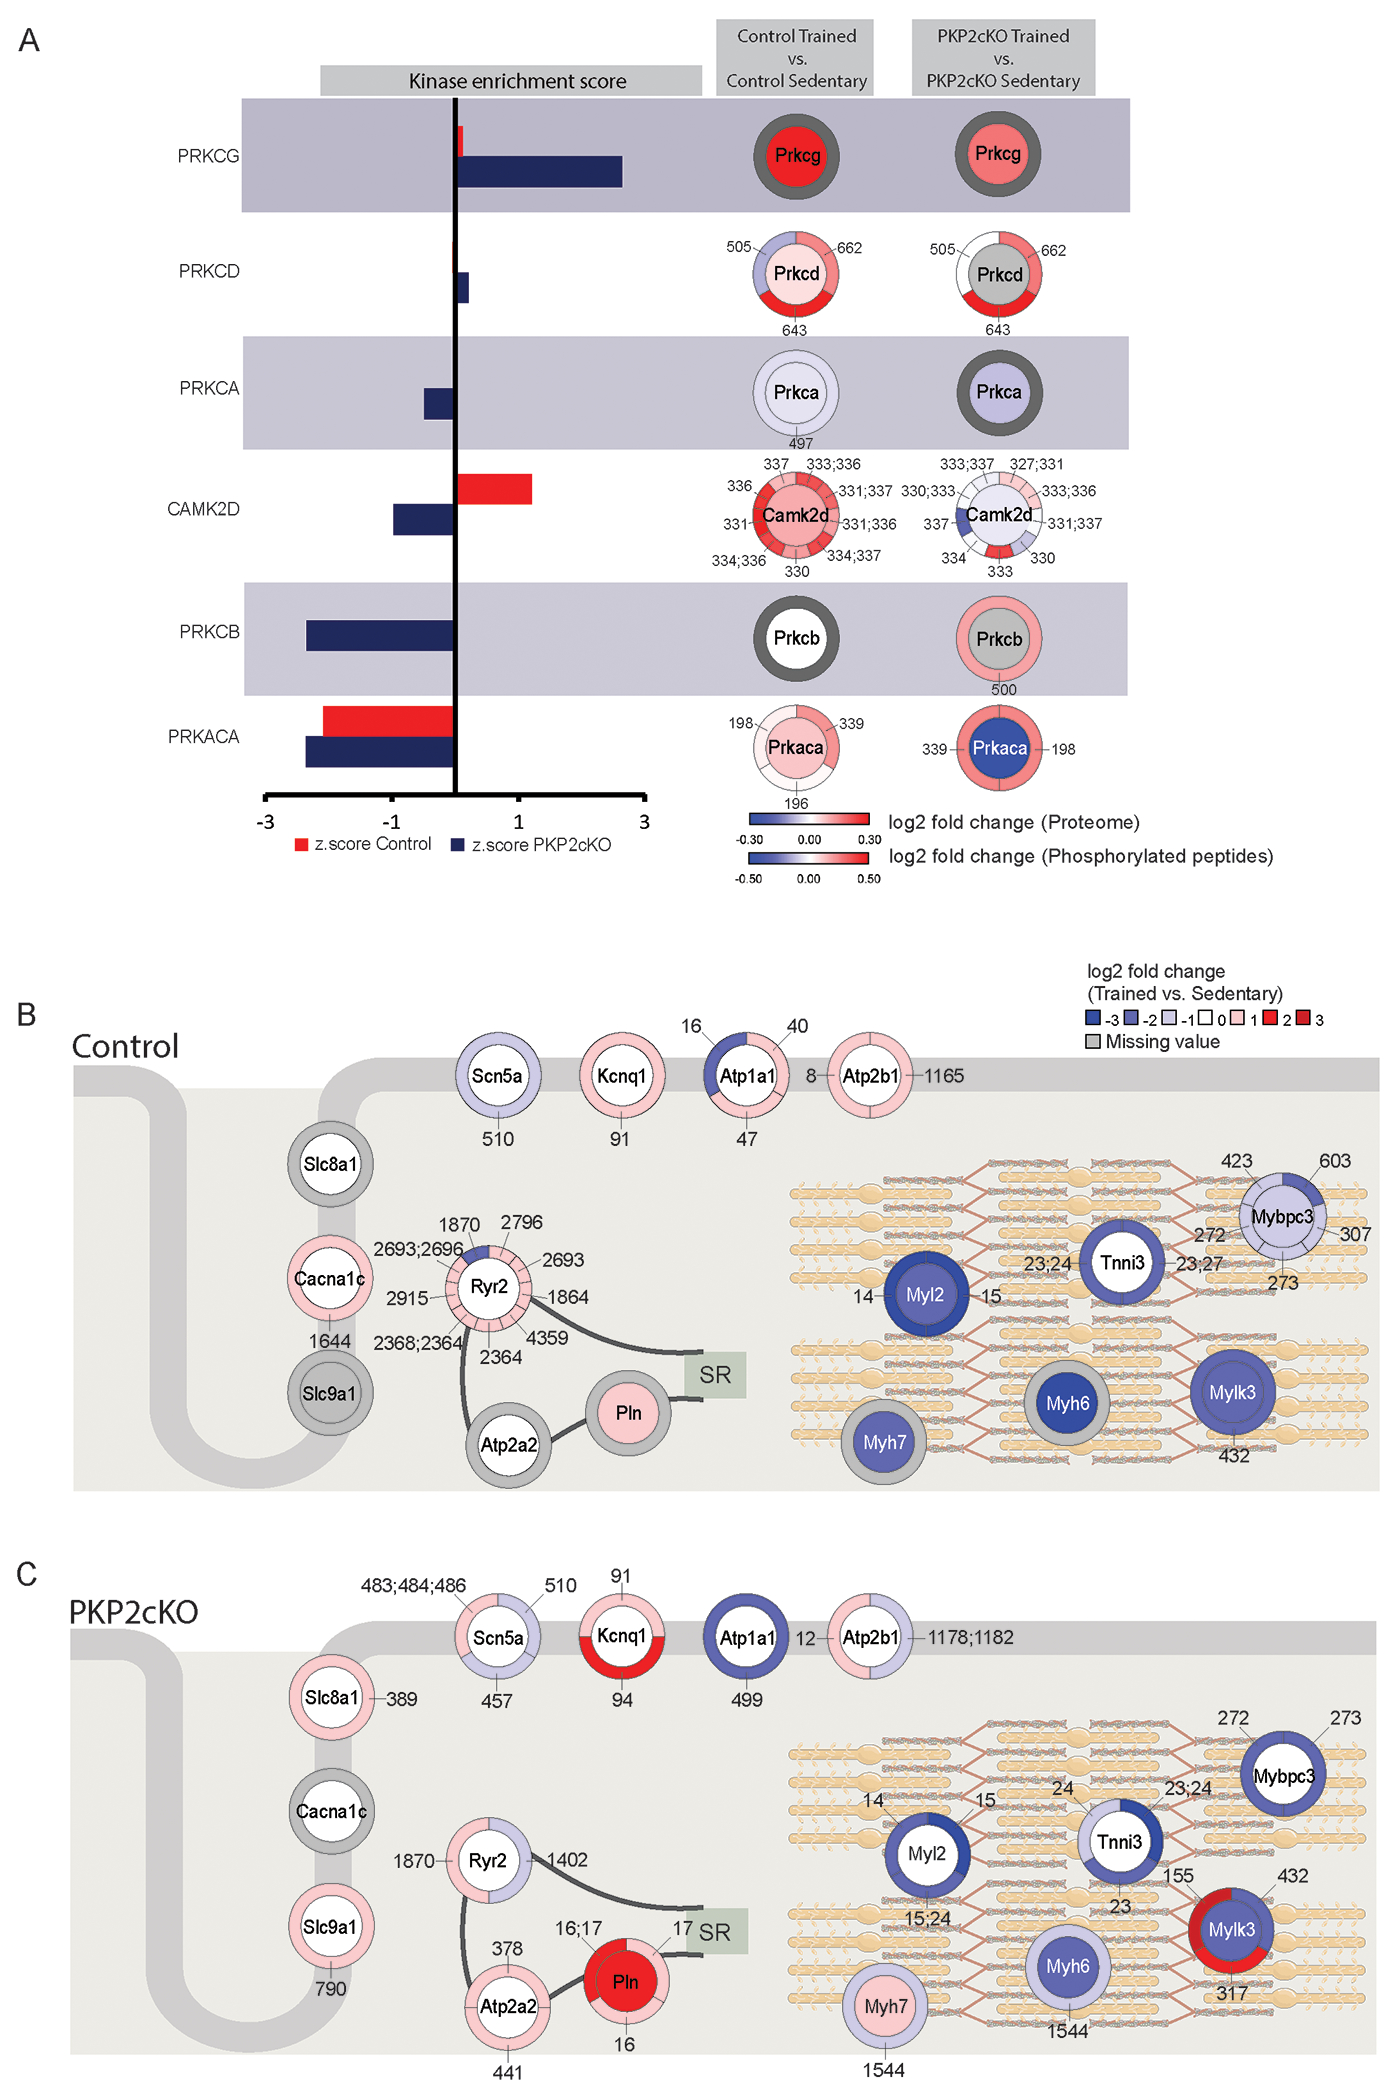
Figure 4. Phosphorylation mediated signaling changes in response to exercise.

(A) KSEA results that show kinases with either up (positive z-score) or downregulated (negative z-score) activity in control (red) or PKP2cKO (blue) hearts upon exercise. Next to each kinase, data from proteome and phosphoprotome is visualized for control and PKP2cKO groups. The inner circle represents changes in protein abundance and the outer circle, changes in phosphorylation state of sites specified (i.e., small numbers note the position of the phosphosite in the protein sequence). Colors are coded as per the scales in the bottom-right of the panel. (B-C): Diagrammatic representation including a heat map that summarizes differential abundance (inner circle) and phosphorylation state (outer circle) of a selected set of proteins residing in the dyad (left) or the sarcomeric complex (right). B): control; (C): PKP2cKO. Both cases reflect differential proteome/phosphoproteome data obtained by comparing trained versus sedentary animals. Tones of red indicate increased abundance in exercised animals and tones of blue, decrease. Only absolute log2FC values higher than 0.3 are represented; white inner circle: protein differential remained below threshold. Small numbers pointing to segments of the outer circles indicate the position of the phospho-site in the sequence of the protein.
