FIGURE 5.

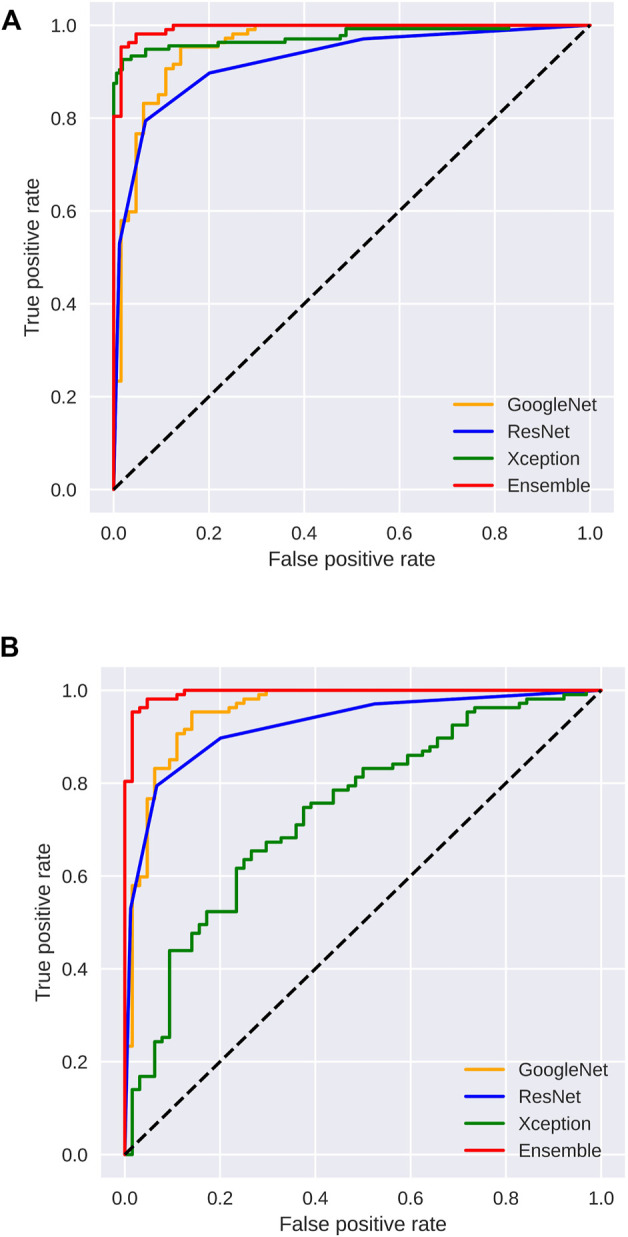
Area under the ROC curve analysis for (A) informative frame detection and (B) cancerous and noncancerous polyp classification.

Area under the ROC curve analysis for (A) informative frame detection and (B) cancerous and noncancerous polyp classification.