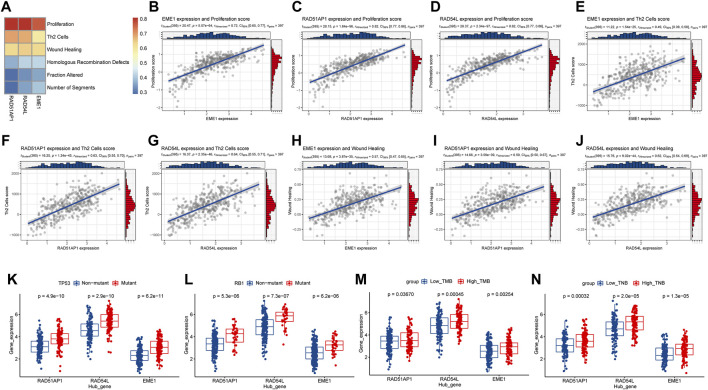
FIGURE 10.
Analysis of the relationship between hub genes in HR and tumor progression and gene mutation. (A), Heatmap of correlation between hub genes and signature scores of core biological functions; (B–J), Correlation diagram between hub gene and the signature scores of core biological functions with moderate correlation; (K,L), Hub gene expression levels in TP53, RB1 gene mutation, and non-mutation samples distribution. (M,N), Distribution of hub gene expression levels in high and low TMB and TNB samples. HR, homologous recombination; TMB, Tumor mutation burden; TNB, tumor neoantigen burden.

