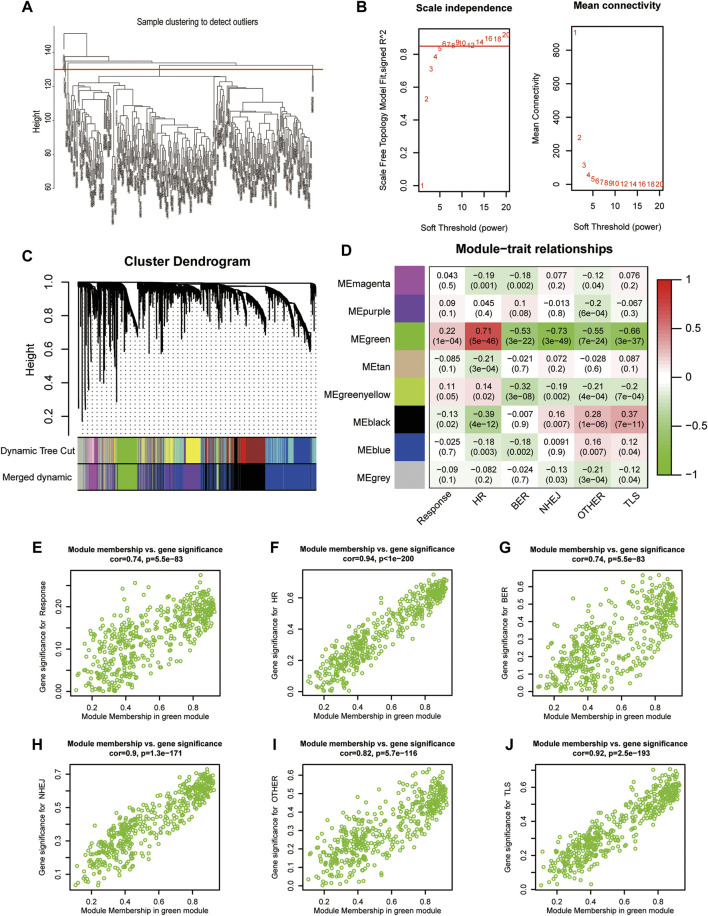
FIGURE 3.
Construction of gene weighted co-expression network. (A), Sample cluster diagram. (B), Analysis of the scale-free topology model fit index for soft threshold powers (β). (C), A cluster dendrogram was built based on the dissimilarity of the topological overlap, which presents different gene co-expression modules in IMvigor210, modules with a clustering degree less than 0.25 were merged. (D), Heatmap analysis of the correlation between module eigengenes of IMvigor210 and enrichment score of DNA damage repair pathway. (E–J), The scatterplot of GS for the response, different enrichment score of DNA damage repair pathway vs. MM in the green module. FA/HR, Fanconi Anemia/homologous recombination; BER, base excision repair; NHEJ, non-homologous end joining; OTHER, other; TLS, translesion synthesis; GS, gene significance; MM, module membership.

