An official website of the United States government
Here's how you know
Official websites use .gov
A
.gov website belongs to an official
government organization in the United States.
Secure .gov websites use HTTPS
A lock (
) or https:// means you've safely
connected to the .gov website. Share sensitive
information only on official, secure websites.
 ) versus a static (
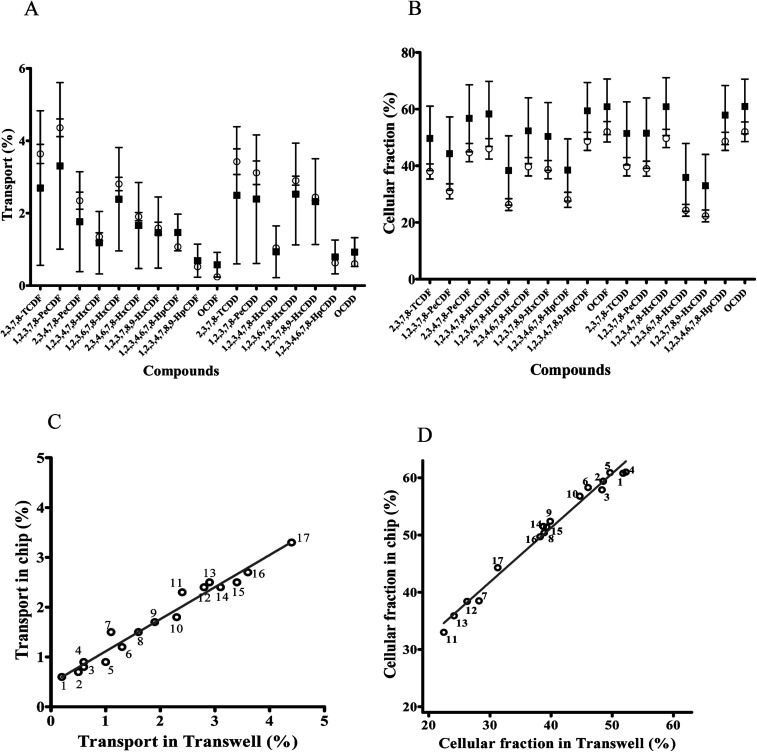
 ) model. (A) Transport of dioxin congeners through the monolayer of cells cultured in chips and Transwells given as a percentage (±SEM) of dioxin congeners in the basal side compared to the total exposed amount. (B) Fraction of dioxin congeners in the cell fraction given as a percentage (±SEM) of dioxin congeners in the cellular fraction compared to the total exposed amount. (C) Correlation between transported dioxin congeners in the dynamic versus static model. (D) Correlation between dioxin congeners in the cellular fraction in the dynamic versus static model, 1 = OCDF; 2 = 1,2,3,4,7,8,9-HpCDF; 3 = 1,2,3,4,6,7,8-HpCDD; 4 = OCDD; 5 = 1,2,3,4,7,8-HxCDD; 6 = 1,2,3,4,7,8-HxCDF; 7 = 1,2,3,4,6,7,8-HpCDF; 8 = 1,2,3,7,8,9-HxCDF; 9 = 2,3,4,6,7,8-HxCDF; 10 = 2,3,4,7,8-PeCDF; 11 = 1,2,3,7,8,9-HxCDD; 12 = 1,2,3,6,7,8-HxCDF; 13 = 1,2,3,6,7,8-HxCDD; 14 = 1,2,3,7,8-PeCDD; 15 = 2,3,7,8-TCDD; 16 = 2,3,7,8-TCDF; 17 = 1,2,3,7,8-PeCDF.