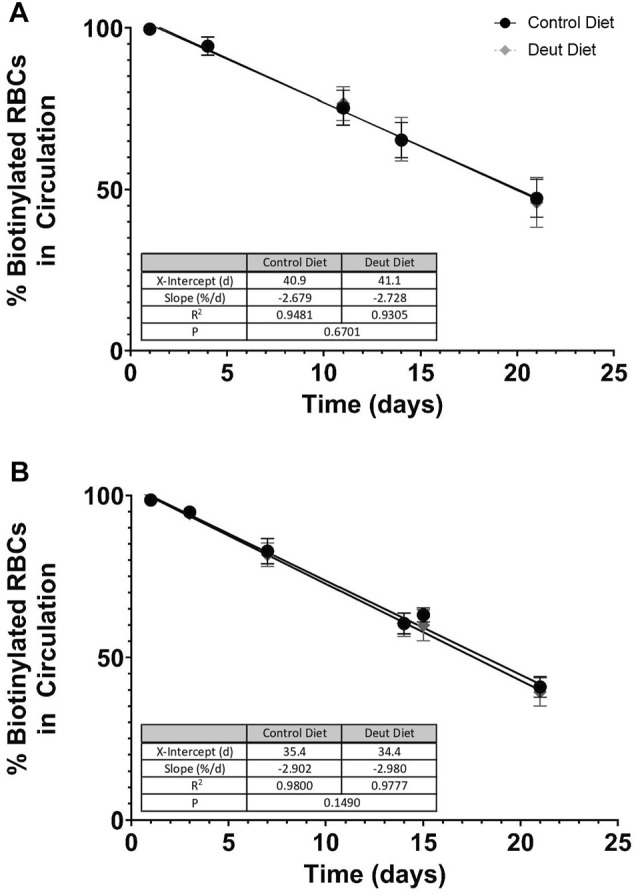
FIGURE 2.

RBC lifespan in vivo. RBCs were biotinylated in vivo after consuming experimental diets for 5 weeks. Serial blood samples were taken via tail puncture on days 1, 3, 7, 14, and 21. At each time point, the total percentages of biotinylated RBCs circulating in C57BL/6J mice (A) and FVB mice (B) were quantified by flow cytometry (n = 15/group). Flow data from days 1–21 were analyzed by simple linear regression with the regression line extrapolated to the x-intercept to estimate the in vivo RBC lifespan for each diet group, with the slope of the line representing the fractional RBC removal rate.
