FIGURE 5.
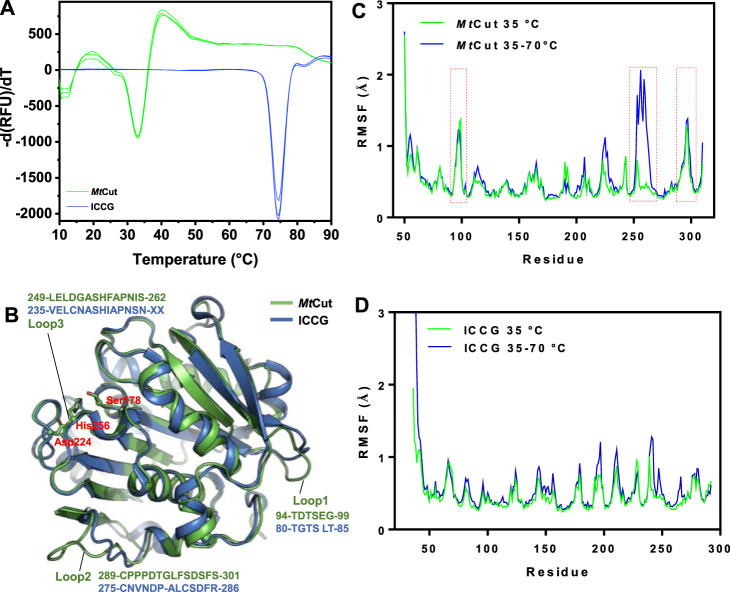
Structural features associated with temperature adaptation. (A) Comparing MtCut and ICCG melting temperature curves. (B) Structures of MtCut and ICCG (PDB entry: 6THT). The catalytic triad (Ser178, Asp224, and His256) is represented as a stick model. Root mean square fluctuations (RMSF) (angstroms) of Cα atoms of MtCut (C) and ICCG (D) structures at different temperatures. The 100 ns simulation trajectories at 35°C and heating from 35 to 70°C for each system were superposed and then used to calculate the RMSF.

