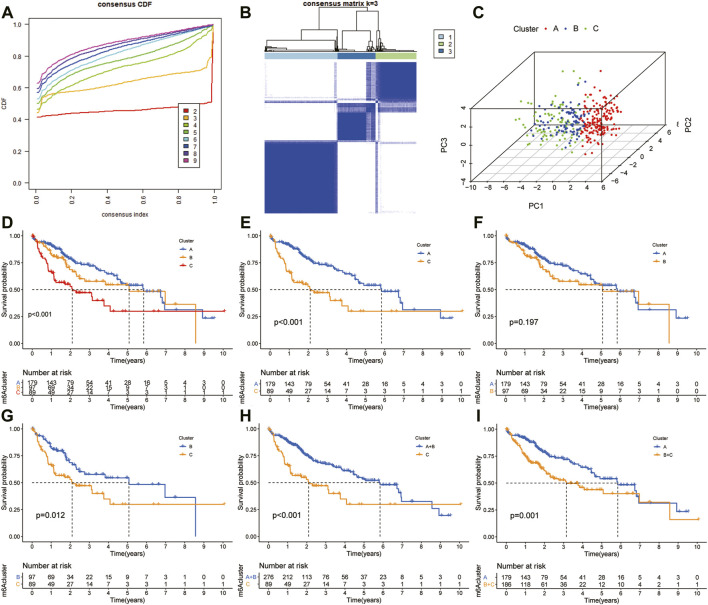
FIGURE 4.
Subclusters and survival analysis based on the expression level of DEGs. (A) Classification of consensus clusters. The cumulative distribution function (CDF) was set from k = 2 to 9. (B) Consensus matrix of three subclusters (k = 3). (C) Three-dimensional PCA of three subclusters according to HCC patients. (D) Kaplan–Meier (K–M) analysis of overall survival (OS) for HCC patients in TCGA cohort with different HCC clusters. (E) K–M curves of OS for HCC patients in TCGA cohort with A and C clusters. (F) Kaplan–Meier curves of OS for HCC patients in TCGA cohort with A and B clusters. (G) K–M curves of OS for HCC patients in TCGA cohort with B and C clusters. (H) K–M curves of OS for HCC patients in TCGA cohort with A + B and C clusters. (I) KM curves of OS for HCC patients in TCGA cohort with A and B + C clusters.

