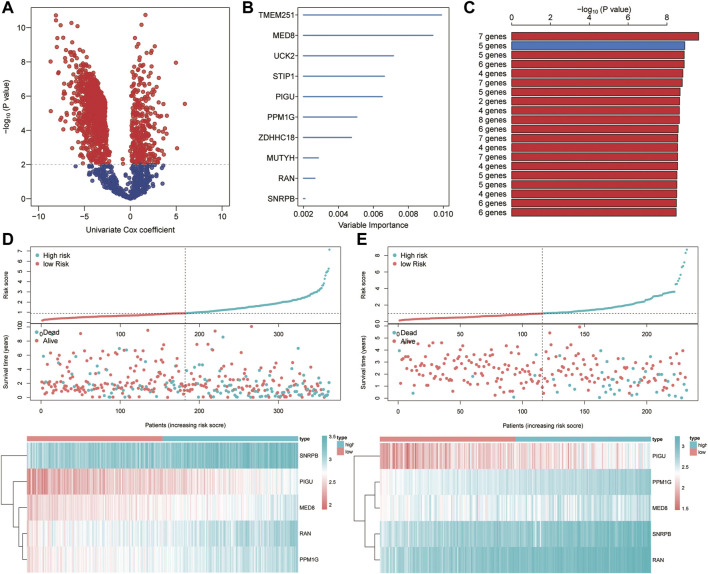
FIGURE 9.
Construction of the ferroptosis-related signature. (A) Identification of overall survival-related DEGs via the univariate Cox analysis. (B) Random survival forest analysis screened 10 genes. (C) Screening the best risk model based on the p value of Kaplan–Meier, and the top 10 models were identified. (D–E) Distribution of the risk scores, survival status, and gene expression between high- and low-risk groups in TCGA (D) and ICGC (E) sets.

