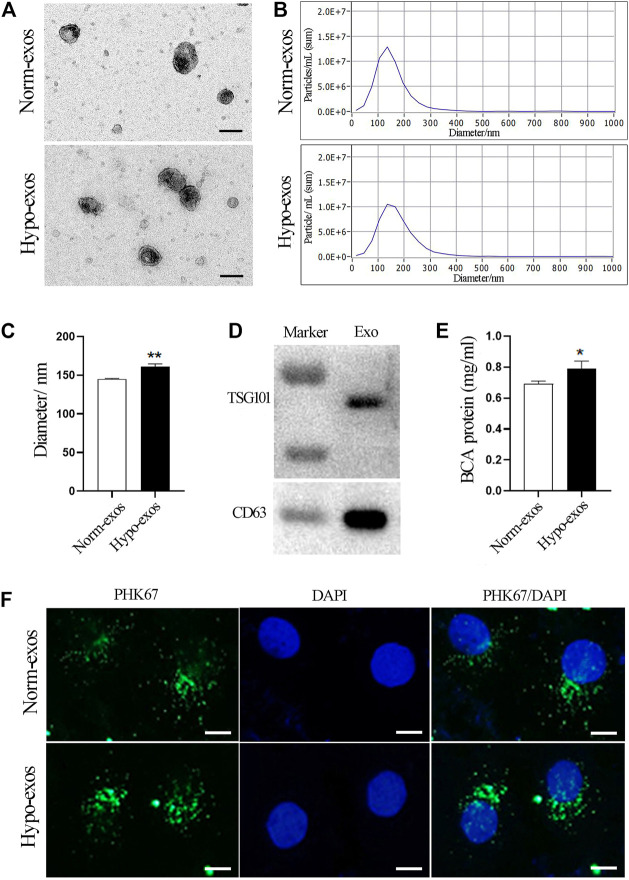
FIGURE 1.
Characterization and internalization of Hypo-exos and Norm-exos. (A) Morphology of Hypo-exos and Norm-exos observed using transmission electron microscopy; scale bars = 100 nm. (B) Particle size distributions of Hypo-exos and Norm-exos were determined by nanoparticle tracking analysis. (C) Comparison of mean diameters of Hypo-exos and Norm-exos. (D) Expression of CD63 and TSG101 in exosomes validated using western blotting. (E) Exosomal protein concentrations in Hypo-exos and Norm-exos analyzed using the BCA assay. (F) Uptake of PKH67-labeled Hypo-exos and Norm-exos into HUVECs; scale bars = 200 μm *p < 0.05, **p < 0.01.

