FIGURE 5.
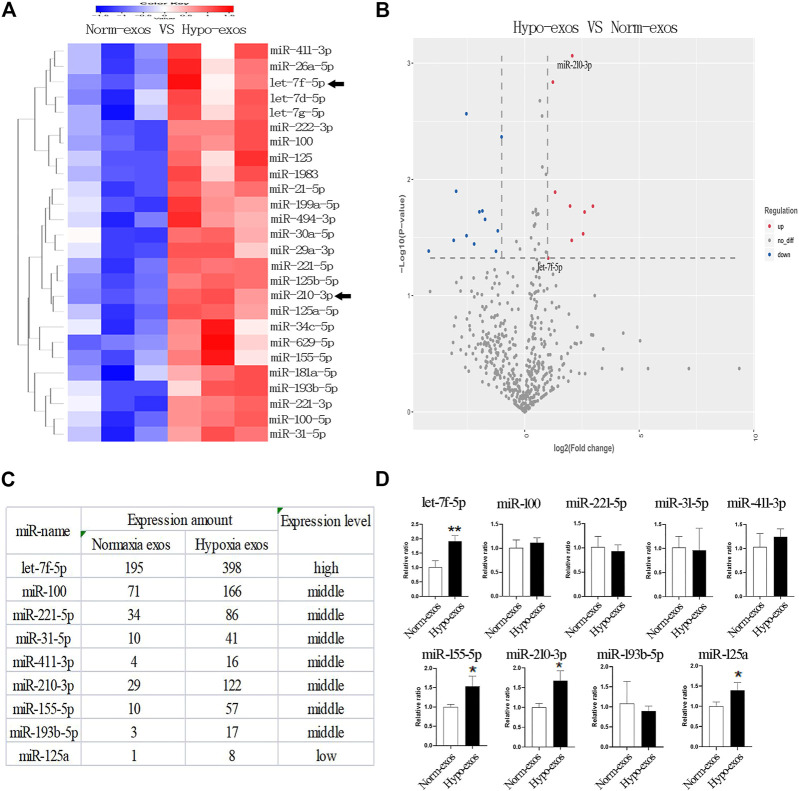
Profiling and identification of upregulated miRNAs in Hypo-exos and in Norm-exos. (A) Heat map showing the profiles of upregulated miRNAs in Hypo-exos compared with Norm-exos. (B) Volcano map revealing nine significantly upregulated miRNAs with a ≥2 fold difference between Hypo-exos and Norm-exos. (C) The nine significantly upregulated miRNAs (≥2 fold, p < 0.05) are listed. (D) Comparison of let-7f-5p, miR-100, miR-221-5p, miR-31-5p, miR-411-3p, miR-210-3p, miR-155-5p, miR-193b-5p and miR-125a between Norm-exos and Hypo-exos by qRT-PCR. *p < 0.05, **p < 0.01.

