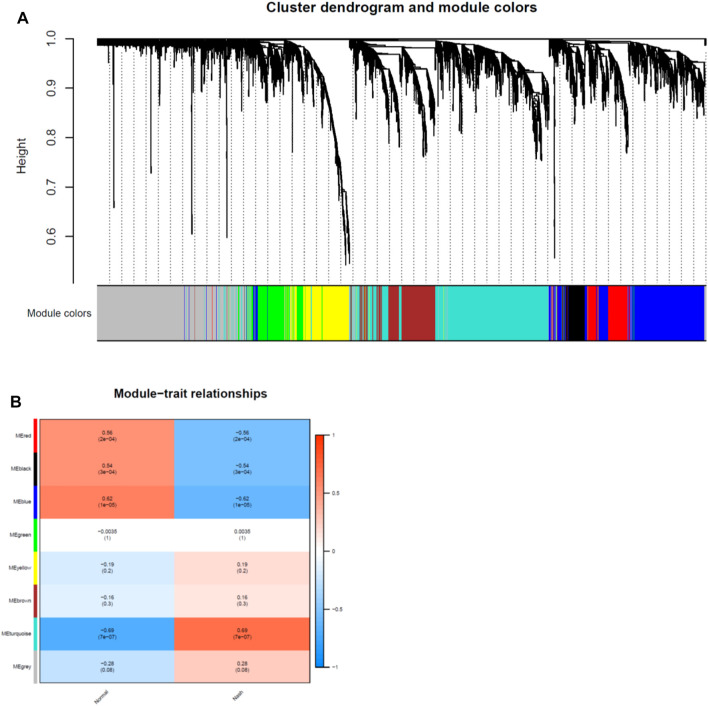
FIGURE 4.
Identification of modules associated with clinical traits in GSE126848 dataset. (A) The Cluster dendrogram of co-expression network modules was ordered by a hierarchical clustering of genes based on the 1-TOM matrix. Each module was colored differently. (B) Module-trait relationships. Each row corresponds to a module and column corresponds to a clinical trait (NASH or HC). Each cell includes the corresponding correlation and p-value.

