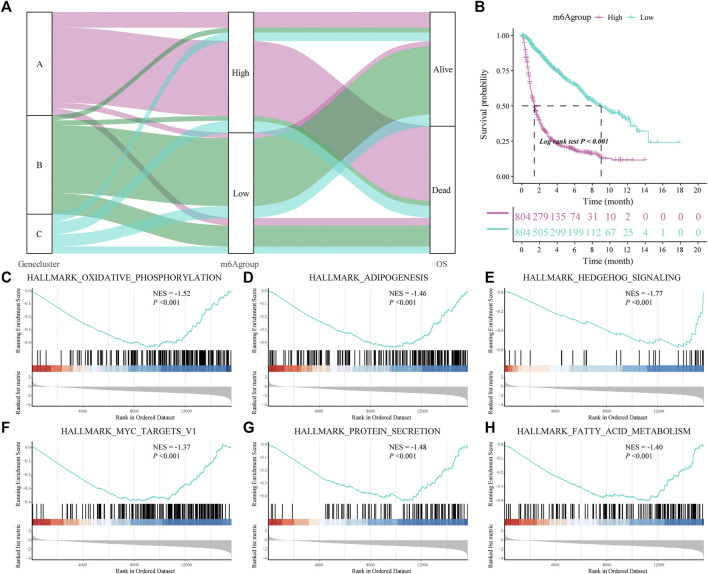
FIGURE 5.
Construction of a prognostic-related m6A characteristic model and regulation of biological processes. (A) The sankey diagram shows the correlation between gene clusters, prognostic-related m6A features (m6Agroup), and patient prognostic status (OS); (B) Survival analysis shows that the prognostic-related m6A feature model can better predict the overall survival rate of glioma patients (Log-rank p < 0.001); (C–H) gene-set enrichment analysis (GSEA) of high- and low-risk patients, the representative gene set downloaded from the MSigDB database, with 1,000 repetitions for each run; GSEA results show that enriched genes of glioma patients in the low m6A group are closely related to hallmark oxidative phosphorylation, adipogenesis, hedgehog signaling and MYC Target V1.

