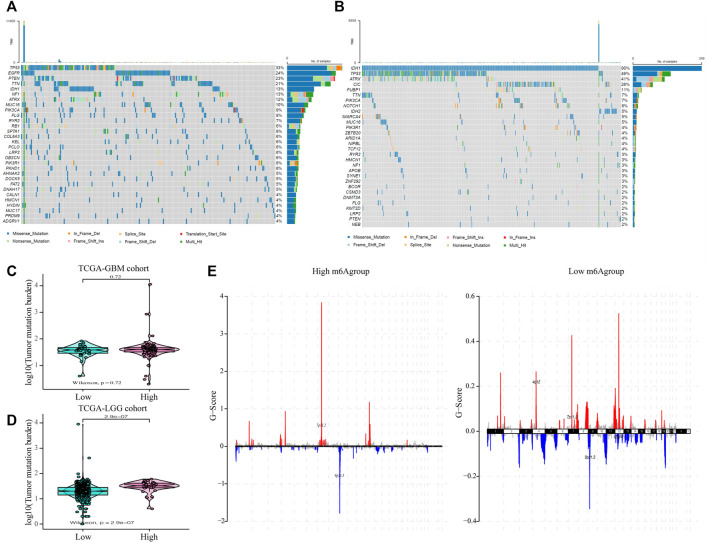
FIGURE 6.
The influence of different m6A risk groups on the genetic variation of GLIOMA patients. (A–B) Mutation maps of common tumorigenesis driver genes in glioblastoma multiforme (GBM) and lower-grade glioma (LGG) patients grouped by high and low m6A groups. The mutation information of each gene in each sample is displayed in the waterfall chart with the total percentage of mutation, and various colors indicate different mutation types; the upper section of the legend shows the mutation load; (C) Compared with the patients in the low m6A group, there was no significant difference in the tumor mutation level in GBM patients in the high m6A group (p = 0.72); (D) Compared with patients in the low m6A group, the tumor mutation level in LGG patients in the high m6A group was significantly higher (p < 0.001); (E) the copy number variation of glioma patients in the high and low m6A groups was different: red indicates an increased copy number, while blue indicates a significant loss in copy number.

