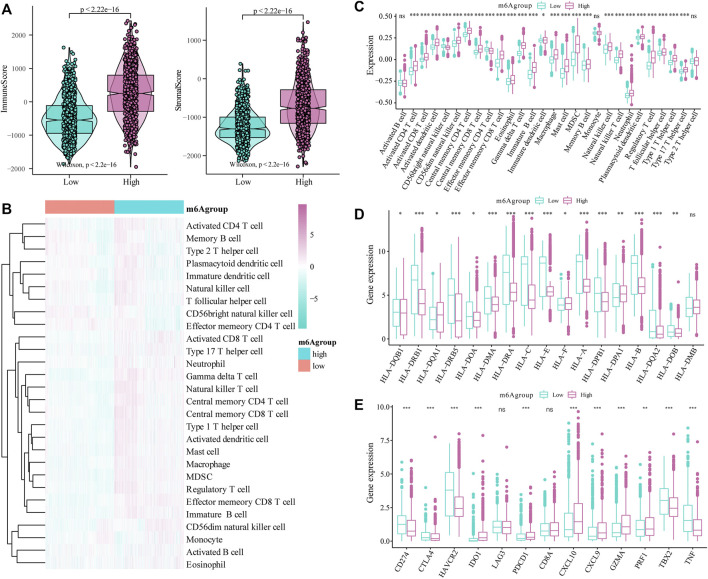
FIGURE 7.
Correlation of the m6A risk score with different immune cell infiltration. (A) Compared with the low expression group, the immune-related scores and stromal-related scores of patients in the high-risk group were significantly increased (p < 0.001); (B) The overall immune infiltration level of glioma patients was analyzed based on the ssGSEA algorithm; (C) Correlation analysis shows that there are significant differences in the expression of multiple immune subtypes in patients in the high and low m6A groups; (D) There are differences in the expression of multiple HLA family genes between the high and low m6A groups; (E) There are also differences in the expression levels of immune therapy-related target genes between the high and low m6A groups.

