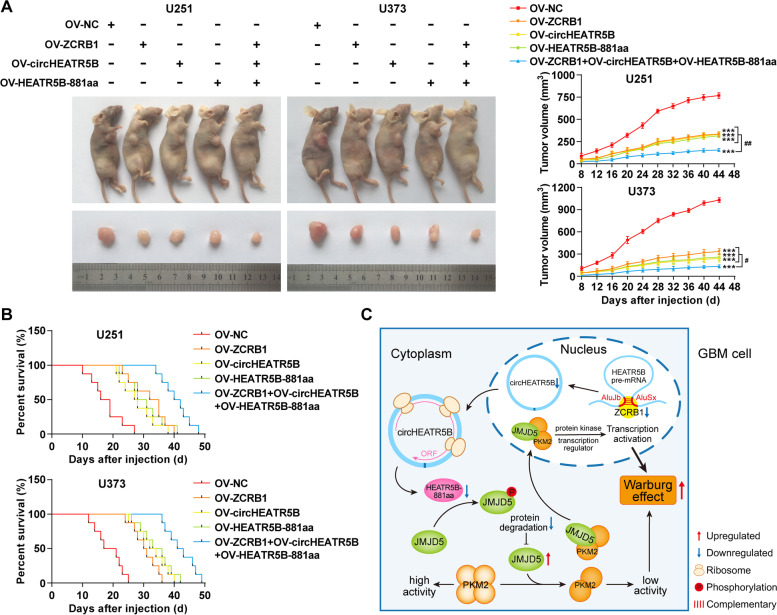
Fig. 8.
Tumor xenograft studies and mechanism diagram. A Left panel, the nude mice carrying subcutaneous xenografts in different groups and the dissected tumor samples from respective groups. Right panel, subcutaneous tumor growth curves. Data are presented as the mean ± SD (n = 5, each group). ***P < 0.001 vs. OV-NC group; #P < 0.05, ##P < 0.01 vs. OV-ZCRB1+OV-circHEATR5B+OV-HEATR5B-881aa group by two-way ANOVA. B Survival curves of nude mice with orthotopic xenografts (n = 5, each group). C The schematic of the mechanisms of the ZCRB1/circHEATR5B/HEATR5B-881aa/JMJD5/PKM2 pathway in GBM cells

