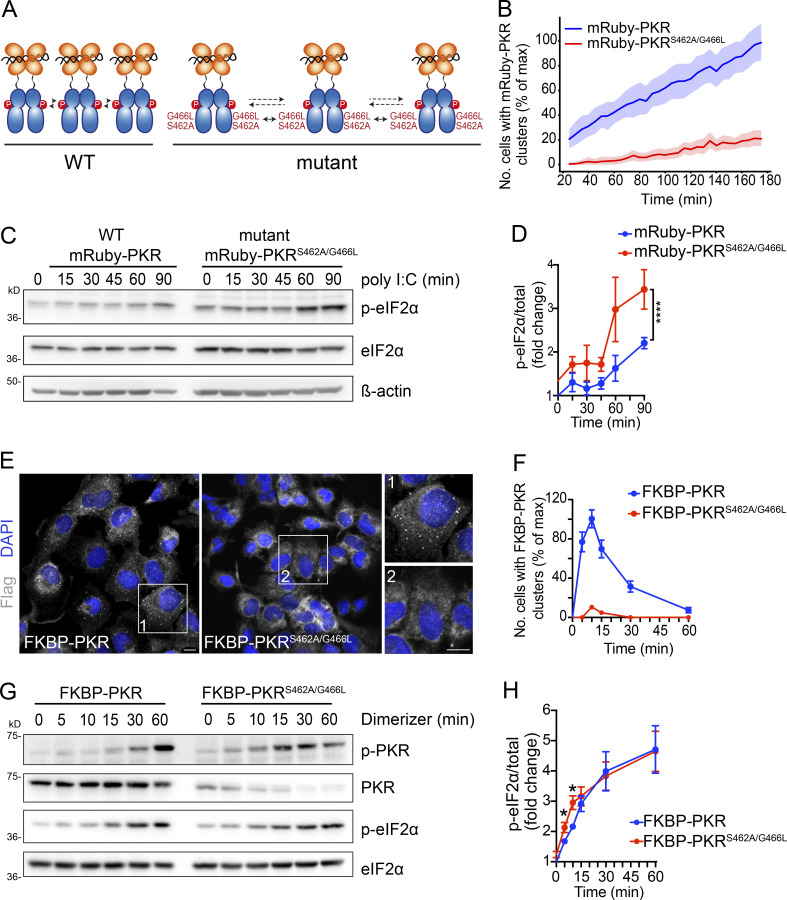
Figure 5.
PKR cluster disruption accelerates and enhances eIF2α phosphorylation. (A) Schematic representation showing the mutations that disrupt PKR’s front-to-front (FTF) kinase interfaces. (B) Quantification of imaging data showing that the mutations in PKR’s FTF kinase interfaces severely reduce mRuby-PKR clusters in cells. Cells with <3 or >50 clusters were not considered in this analysis. The data were binned and are shown as the mean and 95% confidence interval bands; n > 2,000. (C) Western blots showing that cluster-disrupting mutations in mRuby-PKR accelerate and enhance eIF2α phosphorylation in response to poly I:C treatment. (D) Quantification of the data in C (mean and SEM, N = 3 experiments; ****, P < 0.0001, one-way ANOVA). (E) Representative immunofluorescence images showing that the mutations in PKR’s FTF kinase interfaces impair FKBP-PKR cluster formation upon forced activation with a synthetic dimerizer. Scale bar: 10 µm. (F) Quantification of the data in D (mean and SEM, N = 3 experiments, n > 1,000; unpaired Student’s t test, nonparametric). (G) Western blots showing accelerated and enhanced FKBP-PKR autophosphorylation and phosphorylation of eIF2α upon mutation of PKR’s FTF interfaces. (H) Quantification of the data in G (mean and SEM, N = 3 experiments; *, P < 0.05; unpaired Student’s t test, nonparametric). Note that the augmented eIF2α phosphorylation is lost after 15 min, which is consistent with the time of dissolution of FKBP-PKR clusters (see Fig. 3 G). Source data are available for this figure: SourceData F5.

