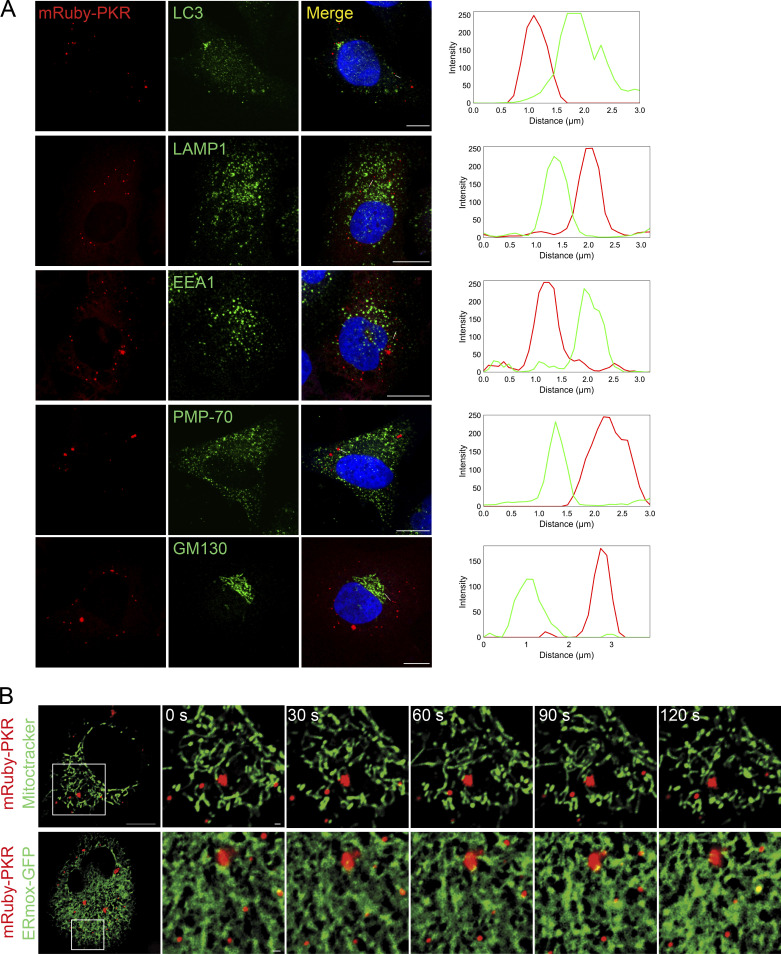
Figure S3.
Colocalization analysis of mRuby-PKR with membrane-bound organelles. (A) Representative immunofluorescence images showing that mRuby-PKR clusters do not colocalize with the autophagosomes (LC3), lysosomes (LAMP1), early endosomes (EEA1), peroxisomes (PMP-70), or cis-medial Golgi apparatus (GM130). The plots of signal intensity of mRuby-PKR clusters (red) and organelle markers (green) as a function of distance were prepared as in Fig. 2 A. The ROIs used for metrics are indicated with a white line. Scale bar: 10 µm. (B) Representative time-lapse micrographs showing transient association of mRuby-PKR clusters with mitochondria (Mitotracker) or the ER (ERmox-GFP). Scale bar: 10 µm; inset: 2 µm.

