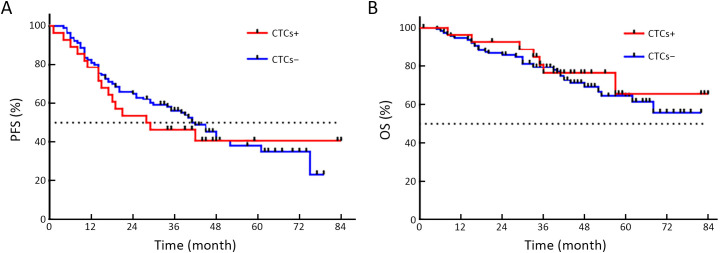
Figure S3.
Comparison of PFS and OS between CTC+ and CTC− EOC patients. (A) Median PFS of CTC+ and CTC− patients was 28.5 and 48.0 months, respectively, but there was no statistical difference (HR=1.137; 95% CI: 0.638−2.025; P=0.386); (B) OS of CTC+ and CTC− patients was not statistically different (HR=0.838; 95% CI: 0.388−1.808; P=0.652). PFS, progression-free survival; OS, overall survival; CTC, circulating tumor cell; HR, hazard ratio; 95% CI, 95% confidence interval.

