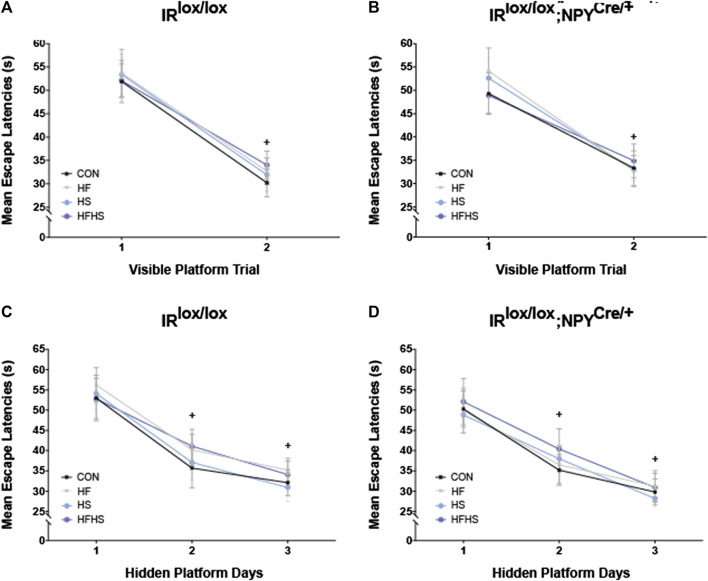
FIGURE 3.
Morris Water Maze performance–Mean Escape Latencies. Mean escape latencies were collected for each trial day to assess performance over time. Across all dietary treatment groups, mean escape latencies were significantly decreased on Day 2 of visible platform trial for IRlox/lox control mice and IRlox/lox;NPYCre/+ mice (A, B). IRlox/lox mice and IRlox/lox;NPYCre/+ mice reached the platform faster across the hidden platform days in all treatment groups (C, D). CON = chow diet, HF = high fat diet, HS = high sugar diet, HFHS = high fat and high sugar diet. Values are expressed as mean ± SEM. + = main effect of time, p < 0.05. Analysed by a mixed ANOVA followed by Tukey’s honest significance difference (HSD) test. IRlox/lox; n = 48 (12/diet group). IRlox/lox;NPYCre/+; n = 48 (12/diet group).

