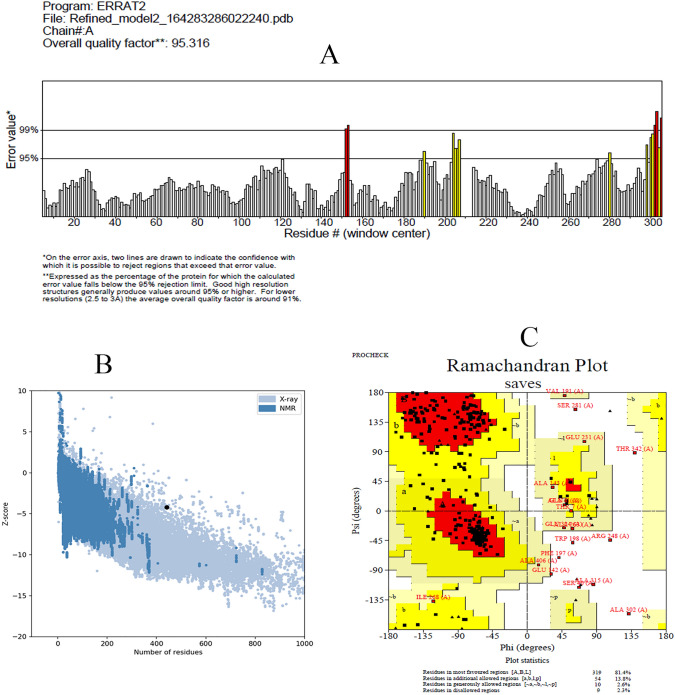
Fig. 3.
Evaluation of the refined 3D model. Part A illustrates ERRAT chart of the 3D model with ERRAT value of 95.316%. ERRAT values around 95% or higher demonstrate good quality model. Part B illustrates ProSA-web Z-score plot. The Z-score (-4.21) of the refined model is shown in a large black dote which is in the range of Z-scores of experimentally 3D structures in the PDB. Part C illustrates Ramachandran plot demonstrating nine (2.3%) amino acids in the disallowed region

