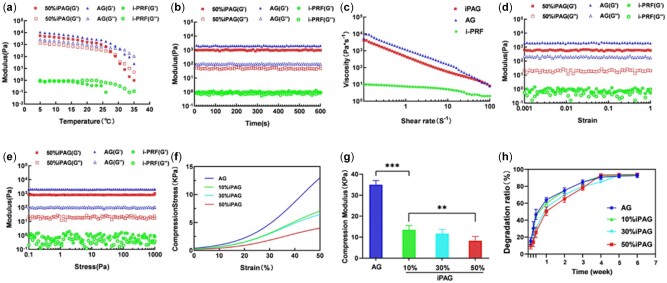
Figure 3.
Rheological behavior and mechanical property of iPAG bioink in comparison to i-PRF and AG. (a) The modulus–temperature curve. (b) The modulus–time curve. (c) The viscosity–shear rate curve. (d) The modulus–strain curve. (e) The modulus–pressure curve. (f) The strain–stress curve. (g) The compression modulus of bioinks. (h) In vitro degradation curves of cell-free iPAG and AG constructs (**P < 0.01; ***P < 0.001)

