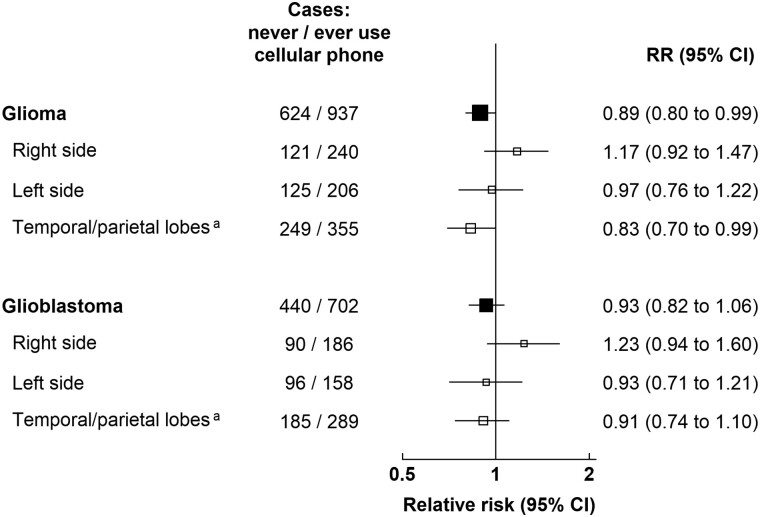
Figure 3.
Relative risks for glioma by location in the brain, in users vs never-users of cellular telephones in median year 2001, UK Million Women Study. Results are shown for ever-use vs never-use only. Results by frequency of use and by years of use can be found in Supplementary Table 1 (available online). aTemporal lobe (C71.2) and parietal lobe (C71.3) only. Relative risks are plotted as squares, with the area of each square inversely proportional to the variance of the log relative risk. Error bars represent the 95% confidence intervals. CI = confidence interval; RR = relative risk.

