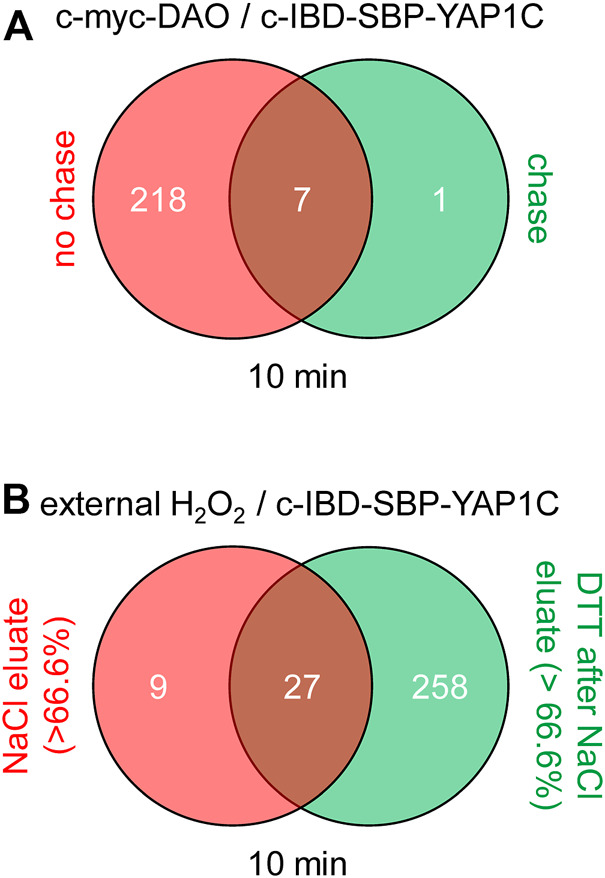
FIGURE 10.

Venn diagrams showing the number and overlap of c-IBD-SBP-YAP1C interactors under different experimental conditions. (A) c-DD-DAO-driven H2O2 production in the absence or presence of a 24-h chase period. (B) External H2O2 addition and elution of the interactors first with 1 M NaCl and subsequently with 10 mM DTT. The threshold values to belong to a specific group reflect the percentage of protein recovered in each fraction relative to the total protein abundance (red: > 66.6% in the NaCl eluate; green: > 66.6% in the DTT after NaCl eluate; brown: less than 66.6% in both eluates).
