FIGURE 7.
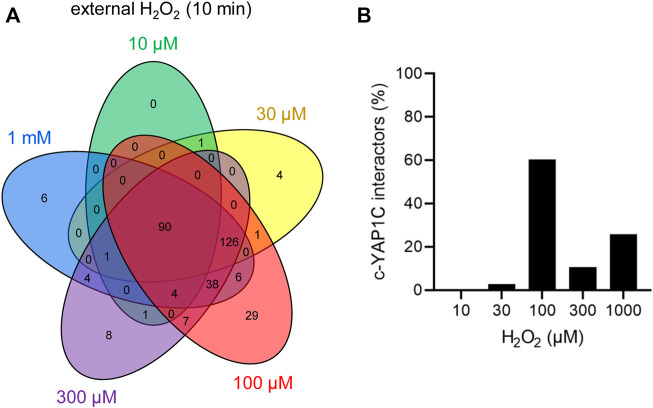
The cytosolic sulfenome in response to different concentrations of extracellular H2O2. (A) Venn diagram showing the number and overlap of significantly enriched interactors of c-IBD-SBP-YAP1C upon treatment of Flp-In T-REx 293 cells with different concentrations of external H2O2 for 10 min. (B) Percentage distribution of total c-IBD-SBP-YAP1C (c-YAP1C) interactors (n, 326) with a sulfenylation peak at the indicated H2O2 concentration.

