Figure 1.

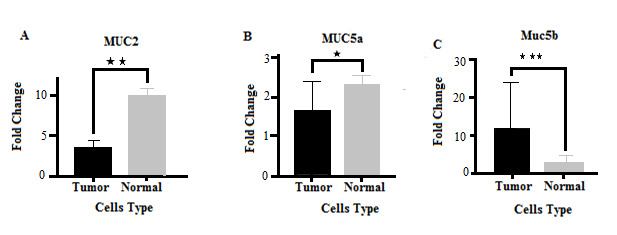
Comparison of MUC2 (A), MUC5A (B), and MUC5B (C) genes expression in normal and cancer cells. *: significant differences at level of P<0.05 ;*** and **: show significance differences at level of P <0.01.

Comparison of MUC2 (A), MUC5A (B), and MUC5B (C) genes expression in normal and cancer cells. *: significant differences at level of P<0.05 ;*** and **: show significance differences at level of P <0.01.