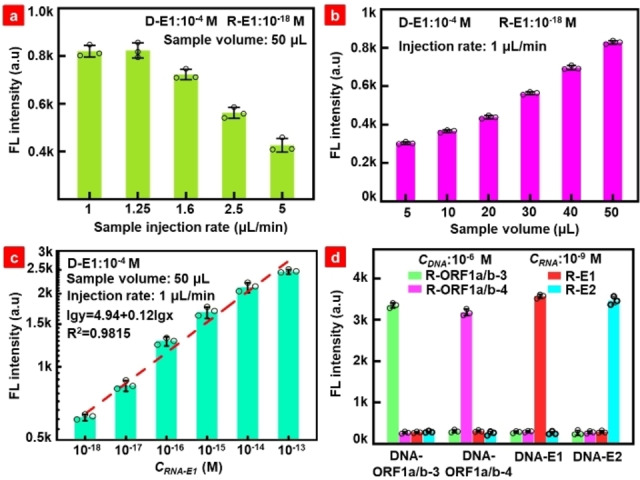
Figure 2.

(a) Fluorescence intensity dependence on the sample injection rate with total volume of 50 μL. (b) Fluorescence intensity dependence on the sample volume at the injection rate of 1 μL/min. (c) Quantitative relationship between the target RNA and fluorescence intensity. (d) Detection specificity of the designed DNA probes to SARS‐CoV‐2 RNAs. The circle represents the measured fluorescence values in three repeated experiments.
