
Figure 3.
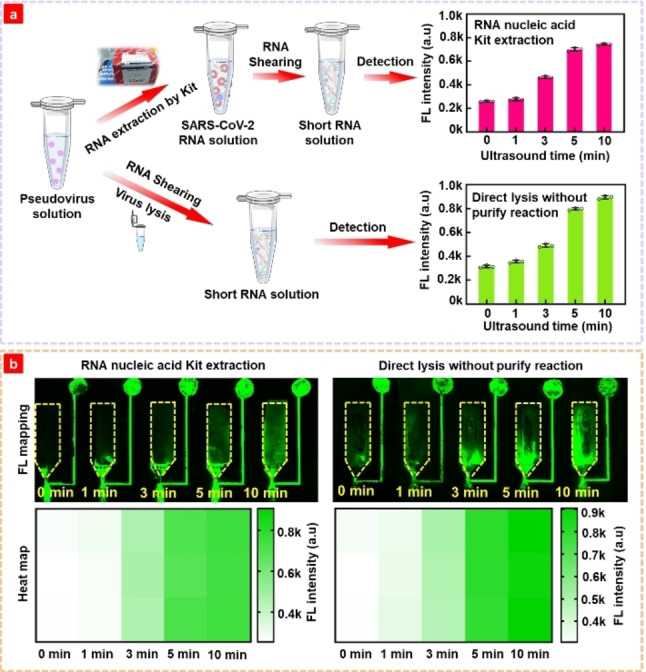
(a) Detection schematic and detected fluorescence of pseudovirus samples obtained by the commercial extraction of SARS‐CoV‐2 RNA using RNeasy Mini Kit and Genomic lysis buffer with different ultrasound time. (b) Fluorescence scanning map and heat map corresponding to the fluorescence intensity result in Figure 3a.