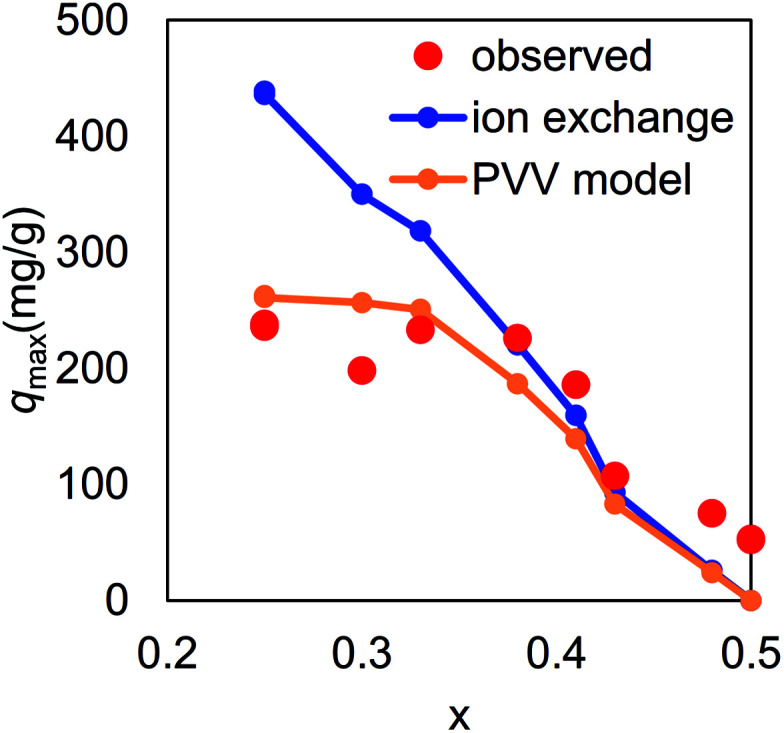
Fig. 9. Cs-maximum capacity of KCuHCF with various vacancy ratios, x. Red circles indicate observed values, the blue line represents a theoretical one calculated with the assumption that all the K+ in KCuHCF exchanged with Cs+, and the orange line was derived from numerical analysis based on the PVV model.

