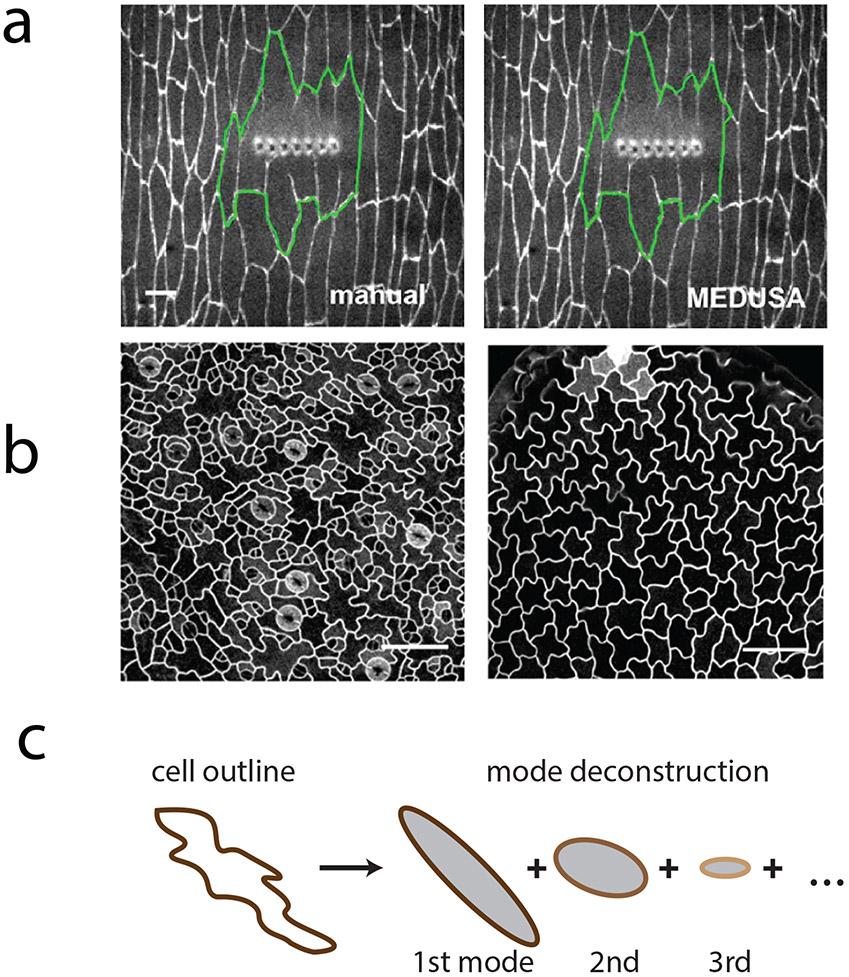
Figure 1:
Analyzing complex cell shapes.
a) A wounded region in the Drosophila embryo expressing β-catenin::GFP. The automated tracing algorithm, MEDUSA, employs an active contour algorithm where the delineation of the wound evolves to minimize its energy (green). Figure is adapted from (Zulueta-Coarasa et al., 2014).
b) Pavement cells in Arabidopsis thaliana exhibit complex shapes. Figure is adapted from (Sanchez-Corrales et al., 2018)
c) Complex cell outlines can be approximated using Elliptic Fourier analysis (LOCO-EFA), which deconstructs cell shape into an infinite sum of elliptical modes. Figure is adapted from (Sanchez-Corrales et al., 2018). Scale bars: 20 μm.

