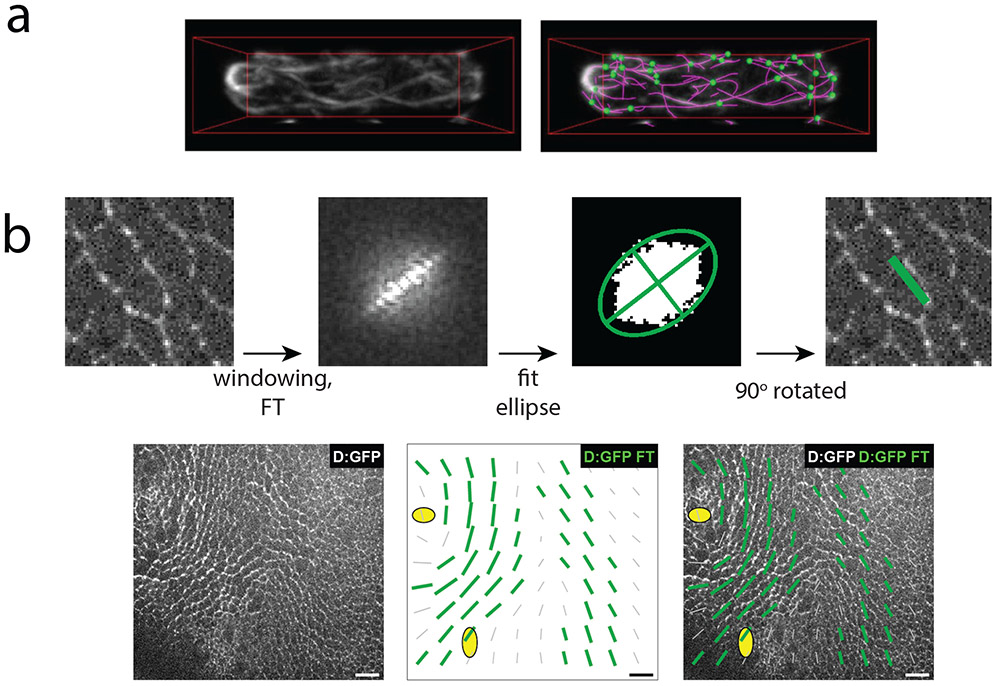
Figure 4:
Analyzing cytoskeletal orientation at single time points.
a) Actin cables in fission yeast marked via GFP-CHD. Actin is traced by SOAX analysis which also infers the topology of the network to identify network junctions (green). Figure is adapted from (Xu et al., 2015). b) A Fourier transform is employed to calculate the local orientation of Dachs:GFP (D:GFP) in the Drosophila dorsal thorax. First the 2D discrete Fourier transform is calculated on the original image (after multiplication by a square cosine function, ‘windowing’, to minimize edge effects). Pixels above the 80th percentile are retained and fitted by an ellipse. From the ellipse the anisotropy and orientation of the original image can be extracted. Green bars plotted over the tissue represent local D:GFP anisotropy. Figure is adapted from (Bosveld et al., 2012). Scale bar: 10 μm.

